
The Herald’s false headline, decorated by a bushfire. But the weather does not light fires. Fires are caused by arson and lightning.
The NZ Herald reports on a new paper that claims to see a “growing hand-print of climate change” on the New Zealand climate since 1871, calling it a “150-year climate transformation.”
However, doubts have been raised. The paper claims our “wider region” has warmed by 0.66 °C from 1871 to 2019. But that is wrong, because records from 1850 show they recorded exactly the same temperatures as today: the country has NOT warmed.
The records are in Transactions and Proceedings of the Royal Society of New Zealand of 1868, held in the National Library in Wellington (image below, right). Today’s temperatures are the same as they were in the 1850s and ’60s.
National average temperature
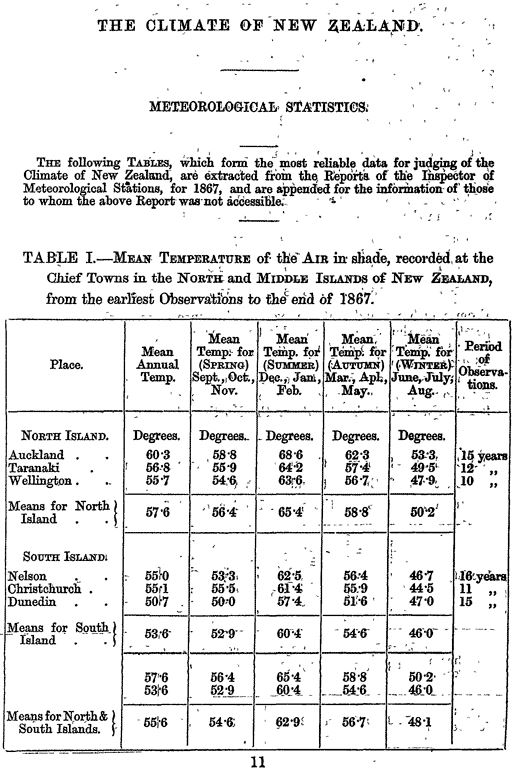
1867: 13.1 °C (55.6 °F)
2019: 13.37 °C (56.07 °F)
The two temperatures (converted from Fahrenheit) are, for all intents and purposes, identical. The apparent difference of 0.27 °C is uncertain and trivial. Cooling remains a statistical possibility. Today’s temperature comes from NIWA’s latest climate summary (scroll down to Overview).
This is beyond the ordinary accuracy of mercury thermometers, which is generally considered to be ±2 °C. Look at the sheer number of readings behind these observations: let us say there was one temperature reading per day, 365 days in most years, 1461 days in four years, six towns and from 10 to 16 years of observations. The minimum number of temperature readings would have been about 22,000 and perhaps over 35,000.
In using a mercury thermometer, observers were commonly advised to record the higher number when the mercury indicated a fraction of a degree. So 58.2 °F would be recorded as 59 °F.
Transformation or travesty?
To call this most tenuous trend a transformation is a travesty of science. Simply calling it warming is unjustified. There has been no warming. There has been no climate transformation. There is no climate crisis—not here in New Zealand, at any rate.
It is unusual for the Herald not to mention what a paper is called or where to find it (and Jamie Morton didn’t answer my email), but Jim Salinger was courteous and helpful. The paper was presented to the Meteorological Society of New Zealand last month and he doesn’t yet have a digital copy of the final version but gave the details as follows:
Surface temperature trends and variability in New Zealand and surrounding oceans: 1871-2019, Weather & Climate 40(1) 32-50 (2020). Lead author: Dr Jim Salinger; co-authors include: Professor James Renwick (VUW) and Dr Howard Diamond (NOAA). Presented to the Meteorological Society of New Zealand’s annual conference on 25 November 2020.
I’ll call the paper JS20.
From invisible to imperceptible
The IPCC (Intergovernmental Panel on Climate Change, AR5, 2013) say human activity caused “more than half” of the warming between 1951 and 2010 if natural variability was small (NOTE – they are guessing). If nature caused more warming, then we caused less, but they don’t know. They estimate (guess) between 0.5 °C and 1.3 °C of warming from 1951, so we can deduce that the human contribution (“more than half”) was between 0.25 °C and 0.65°C (between invisible and imperceptible). Not catastrophic.
Overall, given that the anthropogenic increase in GHGs likely caused 0.5°C to 1.3°C warming over 1951–2010, with other anthropogenic forcings probably contributing counteracting cooling, that the effects of natural forcings and natural internal variability are estimated to be small, and that well-constrained and robust estimates of net anthropogenic warming are substantially more than half the observed warming (Figure 10.4) we conclude that it is extremely likely that human activities caused more than half of the observed increase in GMST from 1951 to 2010. – AR5, Chapter 10, Detection and Attribution of Climate Change: from Global to Regional – p.887 [NOTE: One huge guess.]
But we really ARE warming the world
Maybe not. JS20 estimates total warming from 1871 to 2019 at “about 0.66 °C”. Astute readers will note that leaves little or no room for human-derived warming before 1951, since IPCC suggest the lion’s share of the 0.66 °C rise occurred AFTER 1951—and we know from HadCRUT4 that ALL post-1951 warming took place after 1980. Look at this:
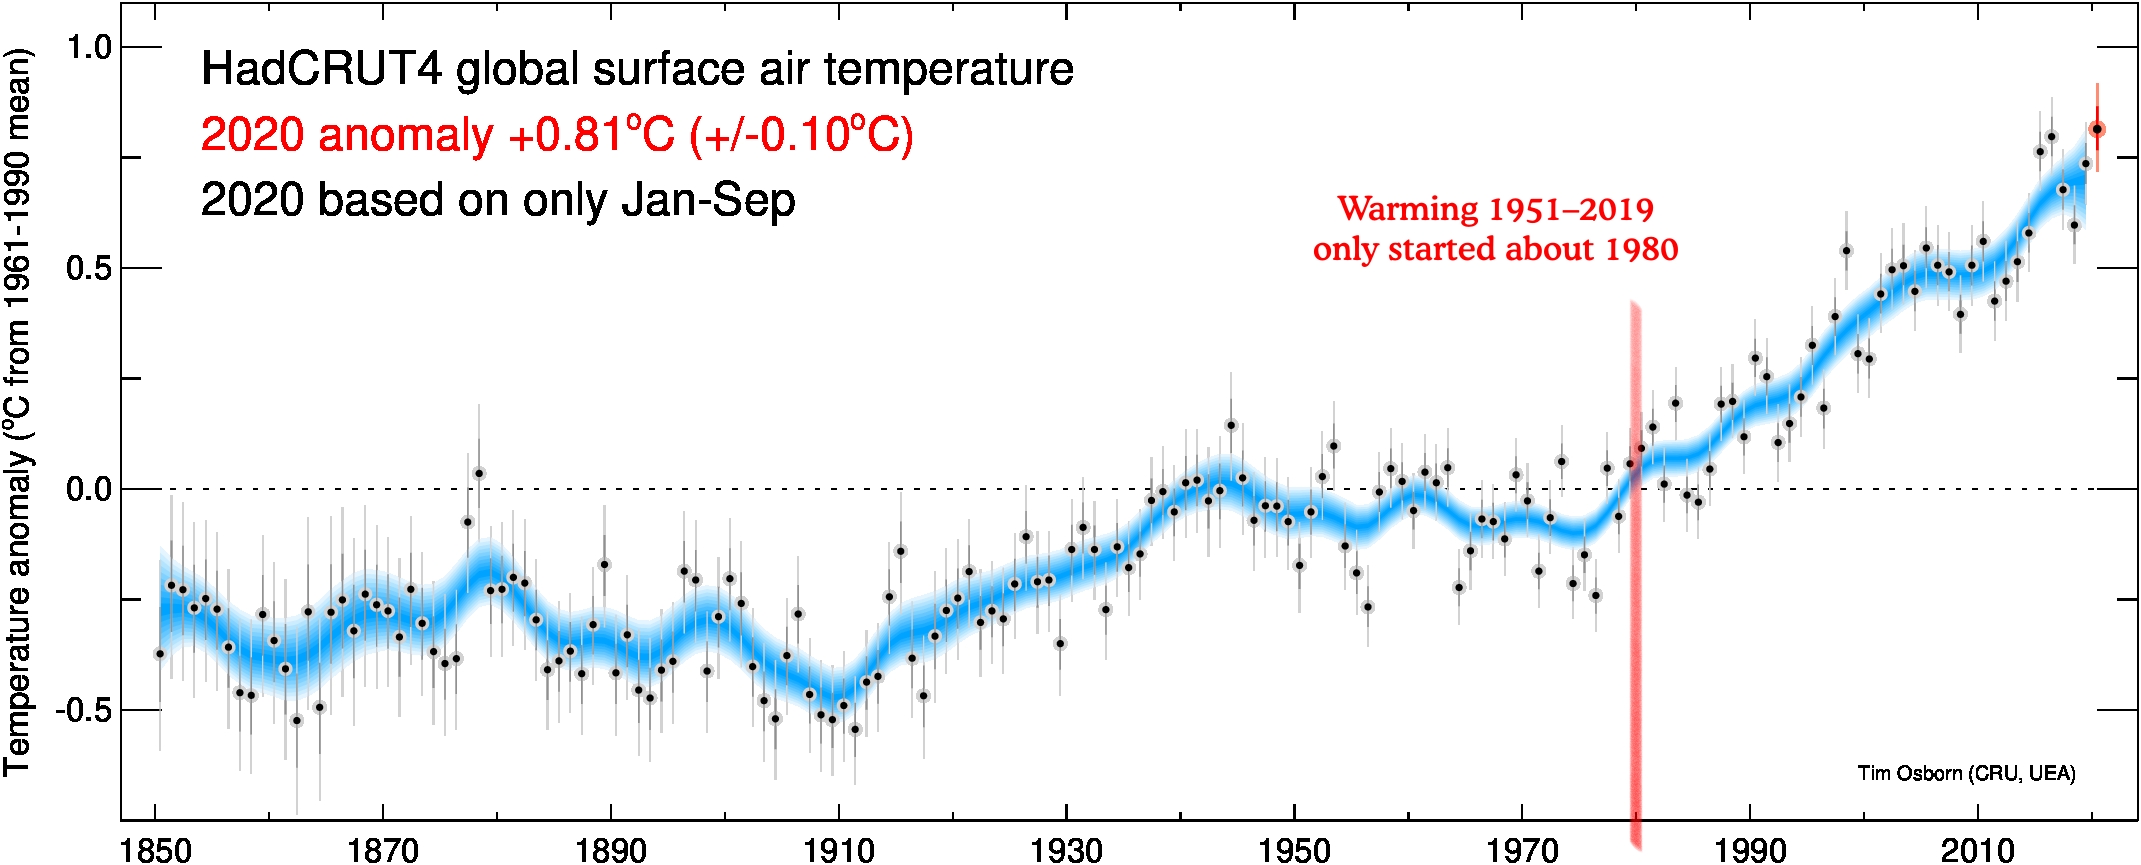
You can see there was no global warming in the last half of the 1800s. Salinger’s paper would be wrong if it claimed any of the 0.66 °C warming occurred before 1900.
NIWA should publish the temperatures from their database for the 19th century. Whatever NIWA’s opinion of their scientific worth, learning of them would enlighten us all. I should probably do it myself—mind you, this is a start, isn’t it?
Anyway, RS20 compares NZ temperatures over land with marine temperatures and apparently discovers those two great marine oscillations called ENSO and the IPO:
They found two big natural drivers that dominated trends were [the] interdecadal Pacific oscillation (IPO) and [the] El Nino-southern oscillation (ENSO).
Salinger explains that they studied marine temperatures to find out “how they might have affected the land temperatures.” But there’s hardly much point in investigating that after we’ve measured the land temperatures—knowing them is enough. Only climate geeks delve deeper. It’s not as though we control the temperature …
“We wanted to cover the larger New Zealand area, not just land, because we are dealing with four million square kilometres that’s home to our fisheries and other parts of our economy.”
What kind of woolly thinking is this? What is the “wider region” or “the larger New Zealand area” and what parts of our economy other than fishing are located at sea? Tourism? America’s Cup? Surfing (not a productive sector)? Coastal shipping? Naval training? We’re not whaling any more, surely?
I grabbed the 7SS data, now updated to December 2018, and found the annual average has slipped above the 1867 average of 13.1 °C on only five occasions (1998, 99, 2013, 16 and 18) and by less than 0.4 °C—ignoring the two occasions when it exceeded 13.1 by less than a tenth of a degree as being climatically insignificant.
UN’s shameless redefinition of climate change
“Climate change” means a change of climate which is attributed directly or indirectly to human activity that alters the composition of the global atmosphere and which is in addition to natural climate variability observed over comparable time periods. – United Nations Framework Convention on Climate Change (1992)
That shameless redefinition, done in 1992 when the WMO and the UNEP created the UN Framework Convention on Climate Change, has been circulating for nearly 30 years. Since it invites confusion between two proper scientific terms, the Herald article implies climate change is our doing. We should be careful to avoid ambiguity, but most are content actually to ignore the natural climate.
Salinger says:
New Zealand has one of the best and oldest temperature records in the world, spanning … the foundational work of Sir James Hector and colleagues in the 1860s.
Indeed it does, and a few years ago Barry Brill, NZCSC Chairman, discovered some of the early temperature data mentioned above.
I was saddened when I read that the study team dedicated the paper to late NIWA climate scientist Dr Brett Mullan—since I thus learned he died last April. I met Brett during our court hearing in 2010 and in brief conversation about my blog criticism of NIWA found him amiable and thoughtful. Stuff published an outstanding obituary.
Views: 125
In an earlier guest post on this blog, I discussed the UN’s opinion that “more than half” of the observed warming during 1950-2000 was caused by human activities:
http://www.climateconversation.org.nz/2018/10/human-influence-is-unquantifiable
In all the thousands of pages published by the IPCC (in both AR4 and AR5), this is the sole “evidence” of human causation. As you say, it was a guess. The report prefers to call it “expert judgment”.
As I point out in my post, the cited basis of this judgment is “robust estimates” which are set out at Figure 10.4(b) (p. 110), purporting to show “the estimated contributions of forced changes to temperature trends over the 1951-2010 period.” These estimates turn out to be eight model runs analysed in Jones1 et al. (2012).
But the model results were transparently manipulated by using a made-up figure of 0.8 °C for anthropogenic aerosols. Jones et al made no pretense of knowing what the actual impact of aerosols was – they just picked a figure out of the air which gave them the result they wanted.
“The IPCC (Intergovernmental Panel on Climate Change, AR5, 2013) say human activity caused “more than half” of the warming between 1951 and 2010….”
and….. “They estimate (guess) between 0.5deg.C and 1.3deg.C of warming between 1951……”
Yes RT, it seems that all this man-made global warming commenced in the year 1950. 1950 is the chosen year…a good round number…. half way through the last century. But it is more likely chosen because all these clowns like to believe they are part of the human induced apocalypse…it’s not going to carry on before our/ their lives because there’s nobody around before about then, to castigate and control. 1950 is as far back as they want to go. 1950 onwards is the age of the “boomers” and these boomers will carry the candle. They’re the ones to blame.
For example, here’s a clown saying….
“Each decade has been warmer than the previous since the 1950’s”
https://notrickszone.com/2020/11/27/climate-alarmist-dana-ready-to-bet-again-on-global-warming-im-in/comment-page-1/#comment-1310514
Just above that, another Guardian , Skeptical Science, climate jerk, Dana Nuccitelli gets querulous with me..
https://notrickszone.com/2020/11/27/climate-alarmist-dana-ready-to-bet-again-on-global-warming-im-in/comment-page-1/#comment-1310379
Good holiday reading for the readers there. Wishing you glad tidings for Xmas and New Year.
Thanks, Barry.
Again, your amazing sleuthing powers expose wicked deceptions behind this climate crisis. More and more people are learning about this. Hits on the blog this December have reached over 1.2 million, compared with the whole of November at 740,000. Surely our leaders must soon acknowledge the changes in attitude towards global warming.
Hi Guys,
You may be able to help me here. I was looking at the HadCRUT4 graph and the temperatures above. From what I have been reading, when Krakatoa erupted in 1883, it dumped an estimated 20 million tonnes of sulphur particulates in to the upper atmosphere and caused a global average temperature drop of
1.2 degrees c., estimated at 0.4 degrees c drop in the northern hemisphere summers. This effect seemed to have lasted for 5 years, 1883 to 1888. I don’t see this in any temperature record. So my question would be, are the temperature records wrong, or did Krakatoa just not have any discernible affect? We either have inaccurate historical temperature data, or an incorrect view of the possible cooling effects of volcanic activity. Also reference to the Mt Tambora eruption that lead to the year without a summer – or 1800 and frozen to death. Just a question that has been bugging me.