
Official complaint regarding inaccuracy
(Sent to the Herald today)
The Herald yesterday carried an article on sea level rise in the Solomon Islands. Villages have been abandoned and whole islands lost beneath the waves. Climate change is forcing people from their homes. Catastrophic sea level rise is already on us and we’re causing it.
This is incorrect. It is another attempt to mislead us into believing our emissions of carbon dioxide are causing sea level rise.
The article leaves a bad taste in the mouth, for the journalist misrepresents the scientific paper it’s based on, claiming that it proves that villages and houses have been lost to anthropogenic climate change, though the paper says nothing of the sort.
The story was written by Ben Guarino at the Washington Post and cites a newly-released paper, Interactions between sea-level rise and wave exposure on reef island dynamics in the Solomon Islands (2016, Environmental Research Letters). Guarino’s description of the paper is grossly misleading:
In a recent paper in the journal Environmental Research Letters, the scientists link the destructive sea level rise to anthropogenic – that is, human-caused – climate change. The study is the first time anyone has concretely analysed the loss of Solomon Island shoreline in the context of global warming, they say.
Global story change
Minutes before posting this, I discovered that numerous papers, magazines and web sites are pushing the story that the new paper proves climate change is to blame for drowning houses and five whole islands. Though I focus on the Washington Post, dozens of outlets have distorted the paper’s results in the same way.
The scientists do not link any shoreline changes to man-made climate change. The Herald should be deeply ashamed to publish this blatantly incorrect statement.
The scientists didn’t study the Solomon Islands to assess the effects of climate change. They thought the Solomons might show them what could happen to Pacific atolls in the future. All the way through, the study is interested only in future climate change and its effects. Perhaps that’s an oddly limited goal, but it’s announced in the first sentence:
Low-lying reef islands in the Solomon Islands provide a valuable window into the future impacts of global sea-level rise.
They specifically state that no link has previously been shown between shoreline recession on reef islands and climate change.
Whilst shoreline recession has been documented on atolls over past decades, the majority of studies have not specifically demonstrated evidence linking shoreline recession to recent sea-level rise (Webb and Kench 2010, Le Cozannet et al 2014). The limited research that has been conducted to date on the responses of reef islands in the western Pacific indicates that islands are highly dynamic, with coastal erosion and inundation threatening infrastructure, resulting generally from extreme events, human armouring of shorelines (e.g. seawalls) or inappropriate planning and development rather than sea-level rise alone (Bayliss-Smith 1988, Merrifield and Maltrud 2011, Ford 2012, Biribo and Woodroffe 2013, Hoeke et al 2013, Mann and Westphal 2014).
This position is adhered to throughout the paper and into the conclusion. Nowhere do the authors say climate change is now causing coastal erosion or inundation, they only say it is predicted, and they do not say the five drowned islands were lost to climate change. They constantly remind us of substantial rises predicted for later this century.
They acknowledge tectonic movements causing land to sink in the Solomon Islands. Guarino, on the other hand (echoed uncritically by the Herald), dramatically announces:
As the ocean rose, they had to flee.
Which is true enough, but leaves out the vital fact that sea level rise (which everybody thinks we cause) was greatly assisted by sinking land (which everybody knows we don’t cause). The lead author, Simon Albert, appears to foster the impression that the paper shows climate change caused the loss of houses and land, but is that actually Guarino again distorting Albert’s emailed comments?
When it comes to island erosion, several factors can mask or overpower the effects of climate change; Albert mentioned plate tectonics, hurricanes, waves, and human disturbances like seawalls or reclamation projects. In the new paper, the researchers attempted to home in on the effects of climate change as much as possible. – emphasis added
So says the scientist—or was it the journalist—and is he referring to present or future climate change? All we can confirm right now is that the paper does not attempt to say what caused coastal erosion, inundation or sea level rise. Instead, it says:
Conclusion
This study represents the first assessment of shoreline change from the Solomon Islands, a global sea-level rise hotspot. We have documented five vegetated reef islands (1–5 ha in size) that have recently vanished and a further six islands experiencing severe shoreline recession. Shoreline recession at two sites has destroyed villages that have existed since at least 1935, leading to community relocations. The large range of erosion severity on the islands in this study highlights the critical need to understand the complex interplay between the projected accelerating sea-level rise, other changes in global climate such as winds and waves, and local tectonics, to guide future adaptation planning and minimise social impacts.
That tells us it was the journalist who inserted comments about “homing in” on the effects of climate change, for the lead author would hardly forget what he had written. But, what was inexcusable, he put the words in the scientist’s mouth. An utterly disgraceful thing to publish — and just to raise false alarm.
SEAFRAME monitoring stations
— Click to enlarge —
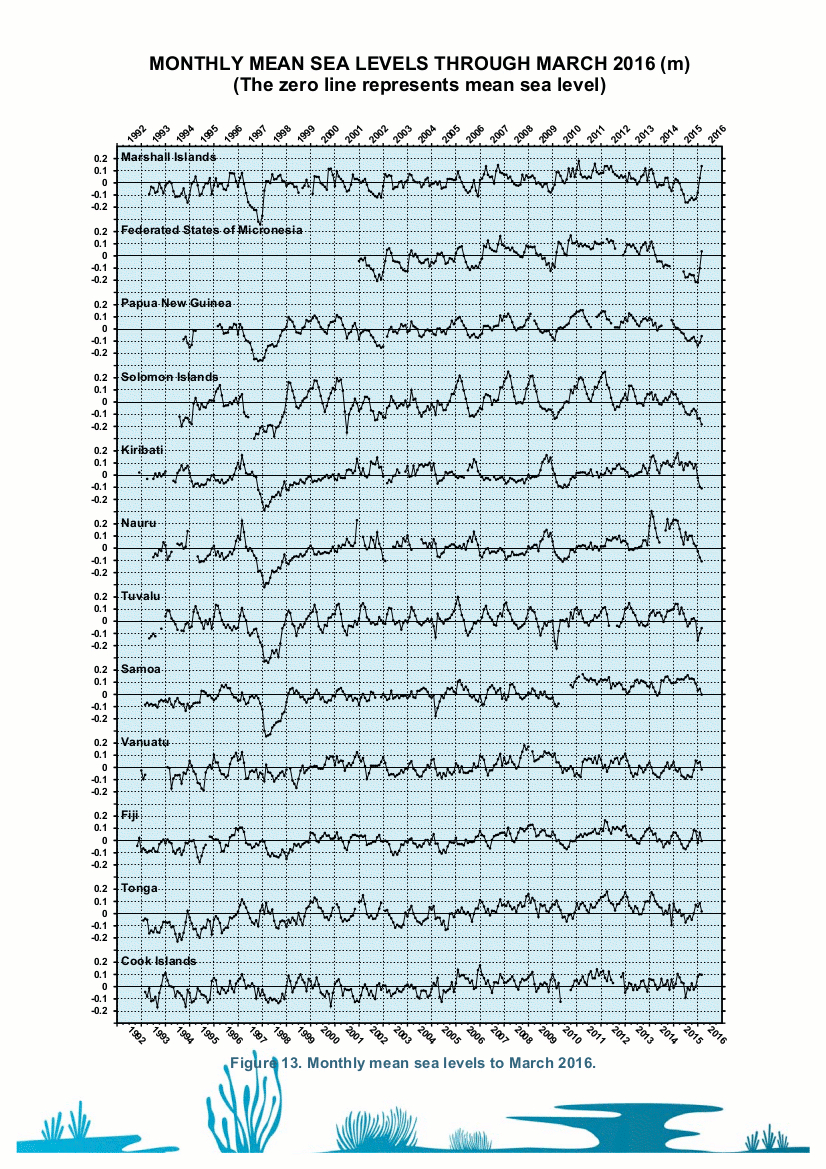
The paper mentions several studies that use tide gauge data. The March 2016 Monthly Data Report (at right) from the long-standing Australian project, the Pacific Sea Level Monitoring Project (PSLMP), shows that over the last 22 years, sea level in the Solomon Islands has risen at an average 4.6 mm per year, for a total rise of 101 mm (four inches), though since 2011 it has been falling. The report advises readers: “Please exercise caution in interpreting the overall rates of movement of sea level — the records are too short to be inferring long-term trends.”
One is hard-pressed to believe houses have disappeared beneath only 100 mm of water. In truth, the only conceivable way that happened was for the land to sink under tectonic movement. Same with the five vanishing islands. Scientists in touch with complex marine and geophysical realities understand this; for some reason this team either don’t understand it or failed to be open about it.
But this whole article is full of hand-waving and hot air; the Herald (and the Washington Post) hoping to sell more shocking newspapers and the scientists hoping for more funding. It seems nobody cares about presenting the truth.
This is an official complaint about inaccuracy
Specifically:
- The headline says the paper blames climate change but it actually assigns no cause at all.
- Statements in the article that climate change is causing coastal recession do not occur in the paper.
- Statements in the article that houses and five islands have drowned because of climate change do not occur in the paper.
Kind regards,
Richard Treadgold.
Views: 354
Lead author Simon Albert supports you all the way RT:
‘Media Exaggerated Vanishing Island Climate Role’
Media exaggerated the role of climate change in the disappearance of five reef islands detailed in a scientific paper published last week, according to the study’s author.
The paper, published on Friday (6 May 2016), reports on the loss of five vegetated reef islands and changes to other reef island shorelines in the Solomon Islands. News stories subsequently appeared in The Guardian, The Daily Telegraph and The Washington Post and other media outlets implying that the study linked the disappearance of the islands to climate change.
But lead author Simon Albert, from the University of Queensland, has complained that the media headlines have misinterpreted the science by confusing sea level rise with climate change and implying the islands were lost due to climate change. The Guardian has run a second story reporting on Albert’s concerns: ““All these headlines are certainly pushing things a bit towards the ‘climate change has made islands vanish’ angle. I would prefer slightly more moderate titles that focus on sea-level rise being the driver rather than simply ‘climate change’,” Albert told The Guardian.
More>>>>>>
http://www.reportingclimatescience.com/2016/05/10/media-exaggerated-vanishing-island-climate-role/
Richard C,
Yes, although there’s a short distance now between sea level rise and man-made climate change because of all the brainwashing we’ve been subjected to by his colleagues, so he’s pushing it by complaining about “confusion” between them. Also, he muddies the water with some of his statements in the paper, doesn’t he?
The scientific paper is poorly prepared.
http://iopscience.iop.org/article/10.1088/1748-9326/11/5/054011
1.The authors do not make it clear that there are no vertical measurements for the disappearing islands. The readers are expected to take the authors’ word that tectonic events (subsidence) have not been involved in the disappearance of the islands. For one of the most tectonically complex regions on Earth, this is hard to swallow.
2. For three of the islands that disappeared, (Ropita, Kakatina, Zollies) the majority of land loss occurred between 1947 and 1962… a time when atmospheric CO2 levels were below 320ppm and would have been an insignificant contributor to any enhanced global warming.
3. Figure 6 is a confusion of naturally fluctuating sea-levels measured in the Solomon islands superimposed on a background of IPCC models of rising sea levels. The reader’s eye is drawn to the increasing trend of the models and away from the actual data that illustrate a repetitive cycle (due to Pacific oscillation) and not an acceleration in sea-level rise.
To a certain extent, the authors must accept responsibility for the inaccurate coverage the MSM has given to their scientific paper. They have a duty to present a clear account of their findings. They created the confusion by announcing on the Australian “Conversation” website that their study was the first evidence of damage to Pacific Islands from rising sea levels…..I followed the comments on that website a couple of days ago and the senior author failed to clarify that the rising sea-levels were not due to enhanced global warming effects from climate change.
Maggy,
Nice analysis, thanks.
I absolutely agree they must accept responsibility.
Here is an article that asks who was responsible for hyping the Climate change angle on the disappearing Islands in the Solomons.
https://cliscep.com/2016/05/10/new-paper-on-disappearing-solomon-islands-spawns-alarmist-media-hype/
Maggy,
Good find, thanks.
From Wattsupwiththat
The sea levels of the Solomon Islands are rising of 7-10 mm yr-1 only by cherry picking
Guest essay by Albert Parker
https://wattsupwiththat.com/2016/05/10/busted-claim-data-shows-that-climate-induced-sea-level-rise-didnt-wipe-out-five-solomon-islands/
The alarmistic claim originates from riding the positive phase of the inter-annual, decadal and multi-decadal oscillations typical of the sea levels over a cherry picked short time window of 10-15 years, neglecting what was measured before 1994 by another tide gauge in pretty much same location, and also neglecting what has been measured in the same tide gauge since 2009.
There’s more and more wrong with this paper; but I don’t see the name Lewandowsky! Strange.
Richard I am merely an interested bystander who drops by here every now and then, I agree with your letter to the Herald absolutely. I also agree with Albert Parker and his assertion that the data is insufficient.
The paper does itself no favours with statements like – (How islands and the communities that inhabit them respond to climate) and (recently observed in the Solomon Islands for all but the very lowest emission scenarios.) As with any mention of “climate change” or “emissions” new meanings and assumptions are made and bias rears its head, I have noticed journalists are particularly good at this.
>”Also, he [Albert] muddies the water with some of his statements in the paper, doesn’t he?”
I haven’t had time to read the paper but going by Maggy’s analysis, she seems to be being kind saying “The scientific paper is poorly prepared”.
But a paper I am familiar with, and I think should be requiresd reading for anyone (especially journalists, and Albert) considering the topic of global or regional SLR, rules out any ideas of a human fingerprint in Pacific sea levels:
‘Is anthropogenic sea level fingerprint already detectable in the Pacific Ocean?’
H Palanisamy, B Meyssignac,A Cazenave and T Delcroix (2015)
http://iopscience.iop.org/article/10.1088/1748-9326/10/8/084024/pdf
The answer is “no”, and we would have to wait decades for a signal to emerge from natural fluctuation (if it ever was to emerge).
Check out Figure 1 (a) page 7, zoom in to 200% say. The stippled areas in the East Pacific are statistically significant sea level FALL of -2 to -4+ mm/year.
2. Data and methods
2.1. Satellite altimetry sea level (1993–2013)
So that’s -20 to -40 mm/decade FALL or 40 to 80 mm total FALL over the series. 4 – 8+ cms FALL.
I say this again a bit differently – ALL of the blue areas are sea level FALL in Figure 1 (a).
Good to hear from you, John.
Also good to see so many people objecting to the MSM and the shallow predispositions expressed in a single paper.
RC,
Cripes, that’s a shocker! A year old, but another paper to read.
Thanks!
In a similar vein:
‘9 mm/year of sea level rise in South East Florida? Only if you cherry-pick’
Guest essay by Albert Parker
https://wattsupwiththat.com/2016/05/11/9-mmyear-of-sea-level-rise-in-south-east-florida-only-if-you-cherry-pick/
“The SLR10 [10 years time windows] changes significantly already month-by-month, and dramatically year-by-year or decade-by-decade. Over the years, the SLR10 has fluctuated between +12.93 and -7.05 mm/year.”
In related news, we have assembled a peer review panel to review the Tonkin and Taylor report for Christchurch.
I’m not sure if this is public yet, so I’ll hold off any further info. The review is supposed to be fairly quick.
Sea level rise expert John Church job loss:
http://www.smh.com.au/environment/climate-change/global-sealevel-expert-john-church-made-to-walk-the-plank-by-csiro-20160513-gov0k9.html
SMH “Sea level rise expert” John Church article:
Yeah right John – WHERE?
I doubt he can find ONE tide guage around the world that conforms to that “average”.
Another tide guage -satellite splice bogosity combined with CMIP5 models (i.e. a double down):
Anthropogenic forcing dominates global mean sea-level rise since 1970
Aimée B. A. Slangen,
John A. Church,
Cecile Agosta,
Xavier Fettweis,
Ben Marzeion,
& Kristin Richter
http://www.nature.com/nclimate/journal/vaop/ncurrent/full/nclimate2991.html
If that’s “expert” then it wont be missed when it’s gone.
Do you really think that you understand more about sea level rise than John Church?
Ask yourself honestly whether you exhibit any of these symptoms:
Cognitive bias,
Illusory superiority,
Self-serving bias,
Ultracrepidarianism ,
Superiority complex,
Metacognitive inability of the unskilled.
John Church is truly a great man.
He has pioneered the technique of splicing together two datasets from different instrumental sources (satellite and tide gauge) that have nothing, apparently, in common, to create the illusion of an acceleration when none exists in either the tide gauge by itself or the satellite by itself
Possibly Nobel Prize material, I would have thought.
>”Do you really think that you understand more about sea level rise than John Church?”
Yes apparently, sea level FALL too. At least able to use an internet connection more effectively than him.
Examples John Church might find enlightening (or not):
Variation of 50-Year Mean Sea Level Trends [NOAA]
http://tidesandcurrents.noaa.gov/sltrends/50yr.htm?stnid=8518750
Proves John Church dead wrong on long running trends and by intermediate moving 5 year 50 year trends.
And,
‘Is anthropogenic sea level fingerprint already detectable in the Pacific Ocean?’
H Palanisamy, B Meyssignac,A Cazenave and T Delcroix (2015)
http://iopscience.iop.org/article/10.1088/1748-9326/10/8/084024/pdf
The answer is of course “no”, and we will have to wait decades if it is to ever emerge. Even then it has to emerge from 20th century natural fluctuation (tall order)
And see Figure 1 Simon, blue area in particular (sea level FALL). Educate yourself and send it to John Church for his edification.
But then your’re just a troll Simon, you wont re-visit your fly-by sniping will you?
From Church and White 2006
http://onlinelibrary.wiley.com/doi/10.1029/2005GL024826/abstract
But no “one metre” projections, even with those rather speculative claims
>”A reconstruction of global sea level using tide-gauge data” [Church and White]
Baloney. There is no such thing as “global” sea level either tide guage or satellite. Beenstock et al showed that conclusively:
The notion of “global” SLR is absurd when 65% of tide guages exhibit no rise at all. It then only takes relatively few guages (35%) to skew the mean. That’s all Church and White are looking at, they fooled themselves with the “global average illusion” and then propagated it for the unwary in the public domain. Suits the IPCC for that purpose of course.
And John Church has learned zip about SLR since 2006 apparently.
Yes, even THEY find no significant rise ahead! However, it must be a blatant exaggeration that they describe a claimed acceleration of 1.3 mm/100 yr as “significant”, considering the 20th century rise was only 1.7 ± 0.3 mm/yr. They’re calling a mere 100th of that significant. I haven’t looked at the detail, but I’d hazard a guess it’s well within the margin of error.
RT
>….it must be a blatant exaggeration that they describe a claimed acceleration of 1.3 mm/100 yr as “significant”
No, the acceleration they claim is stated in technically correct terms for an “acceleration”, viz:
0.013 ± 0.006 mm yr−2
This means 0.013 mm per year PER YEAR i.e. the rise is accelerating 0.013 mm ON TOP OF the previous years rise. So if say (just to demonstrate), a starting constant non-accelerating trend is 1 mm/yr, then the acceleration commences. 1 yr after the commencement, 1 + 0.013 = 1.013 rise. After 2 yrs 1.013 (1st yr) + 1.013 + 0.013 (2nd yr) = 3.052 mm rise over 2 yrs since commencement and so on.
After say 10 years, the linear trend of the “acceleration” will pass ABOVE the accelerating CURVE in the early part and BELOW the curve in the later part and will be GREATER than the original 1 mm/yr obviously.
So with the actual globally averaged data (bogus – see below), C & W end up with (annotated):
“a 20th century rate of sea-level rise of 1.7 ± 0.3 mm yr−1 [linear trend] and a significant acceleration of sea-level rise of 0.013 ± 0.006 mm yr−2 [acceleration]”
Note the “and” in the middle of the sentence i.e. the linear trend AND the acceleration within it. Basically two different descriptions of the data.
Problem is: NO tide guage around the world exhibits that profile. In other words, the global mean does not actually exist anywhere. See my quote from the Beenstock et al abstract linked just upthread reproduced in part here:
“In these [rising] locations, covering 35 percent of tide gauges, sea levels rose on average by 3.8mm/year. Sea levels were stable in locations covered by 61 percent of tide gauges, and sea levels fell in locations covered by 4 percent of tide gauges. In these locations sea levels fell on average by almost 6mm/year.”
The US Foce discovered that the “average” pilot, for whom they had designed cockpit ergonomics, did not exist after their planes were crashing far too often (17 in one day at worst).
Same for C & W’s “global mean sea level”. It does not exist anywhere (and certainly doesn’t when they splice satellite data to tide guage data, these are different measurements – relative vs absolute)
I can’t seem to reproduce the “280 to 340 mm, consistent with projections in the IPCC TAR.” with the accelerations defined.
The formula for SLR assuming a quadratic is:
s(t) = v t + (1/2) a (t^2)
where v = linear trend at start, a = acceleration, and s(t) = sea level at time t
It is possible they left the 2 out in the extrapolation, though the “half” bit gets mentioned in the paper in calculating the acceleration from the assumed quadratic fit
RC,
Thanks for your comments. I understand what acceleration means, but expressed it very poorly. I certainly shouldn’t have said “1.3 mm/100 yr”. What I meant to say was simply that the amount of acceleration was about 0.01 of the rate of rise over the century: in other words, small. My use of “significant” didn’t follow any statistical calculation. I’m guessing when I say the acceleration was not significant.
My take-away headline is:
“Sea levels are not rising according to 65 percent of tide gauges”
Should be:
“The US [Air Force] discovered that the “average” pilot……..did not exist”
>”I’m guessing when I say the acceleration was not significant.”
Yes, Andy’s onto that. The “average” measured acceleration does not RE-produce the greater SLR acceleration produced by the CO2-forced climate models.
That’s because a) relatively small localised areas (“Baltic and Adriatic seas, South East Asia and the Atlantic coast of the United States” – Beenstock et al) skew the global mean rendering it meaningless and b) CO2 forcing is obviously not the sea level driver in any ocean basin.
Again, this paper from upthread is critical:
‘Is anthropogenic sea level fingerprint already detectable in the Pacific Ocean?’
H Palanisamy, B Meyssignac,A Cazenave and T Delcroix (2015)
http://iopscience.iop.org/article/10.1088/1748-9326/10/8/084024/pdf
Ans: no.
The term “significant” has a statistical meaning that is often misused, including by myself I suspect.
The issues of “global” SLR are of course important.
However, I can’t for the life of me reproduce the range of SLR at 100 years deduced by Church and White
Should be:
“Yes, Andy’s onto that [but using the quadratic formula to calculate rather than guessing]”
Apologies, I get a bit garbled at this time of year – 11 hr nightshifts x 6 days a week etc.
I really don’t know how you do it, my friend.
Andy
>”I can’t for the life of me reproduce the range of SLR at 100 years deduced by Church and White”
That was, “280 to 340 mm, consistent with projections in the IPCC TAR” 1990 to 2100″.
Their historical quadratic doesn’t give this?
Just intuitively I would have thought the historical projection would fall well short of TAR.
Initial SLR velocity = 1.7
Acceleration (max) = 0.013 + 0.006 = 0.019 mm yr-2
So, after 100 years, SLR increase = 170mm + 0.019 * 10^4 / 2
= 265mm
If I add in the error bounds for initial SLR velocity (0.3mm) I get a max of 295mm
This is a long way short of the 340mm quoted from the paper
If you do the same for the minimums, it looks like they have forgotten the division by two in the acceleration part.
Please tell me I am doing something dumb here.
1.7 ± 0.3 mm yr−1 is the mean for the 20th century. It is not the assumed SLR for 1990, which looks to be between 1.8 and 2.3 mm yr−1. It is not obvious from the paper.
This paper is ten years old now. Dr Church believes that the current acceleration is now around 3 mm y-2. Given the high level of uncertainty, you would think that the Australian government would be keen for the research to continue. Apparently not, because the science is ‘settled’.
You can’t claim that an acceleration, “previously undetected”, of 0.013 mm yr -2 exists and then claim that SLR has jumped from 1.7 to 2.3 mm yr-1
We need to work with a set of logically consistent assumptions, which as Simon correctly points out, isn’t clear from the paper
The raw data for C&W 2006 can be downloaded at this link:
http://www.psmsl.org/products/reconstructions/church.php
Oops, I meant a current SLR of 3 mm y-1. I see there was an update of the paper in 2011:
http://link.springer.com/article/10.1007%2Fs10712-011-9119-1
which estimates the acceleration at 0.009 ± 0.004 mm year−2. This would put the 21st century sea level rise of sea level at 34.8 cm by my estimation. A long way from 1m but it doesn’t take a big change in the rate of acceleration to blow that estimate away. The research has to continue but it doesn’t look like CSIRO is prepared to do it.
Andy
>”I get a max of 295mm This is a long way short of the 340mm quoted from the paper”
No, it’s within the lower end of the range 280 to 340 mm for TAR that C&W state, viz. “280 to 340 mm, consistent with projections in the IPCC TAR” 1990 to 2100″.
However,
>”Initial SLR velocity = 1.7″ [mm/yr at 1990]
Where?
Auckland: 1.29 mm/year 1903 to 2000,
Sydney: 1.54 mm/year 1897 to 2010
From http://tidesandcurrents.noaa.gov/sltrends/sltrends_global_station.htm?stnid=680-471
But NOAA’s 50 year trends centred nearest 1990 are nowhere near the long running trends and far LESS than for mid 20th century:
50 yr trends
Auckland: 0.52 mm/year centred 1985, 2.18 mm/yr centred 1950
Sydney: 0.78 mm/yr centred 1985, 1.6 mm/yr centred 1950
From http://tidesandcurrents.noaa.gov/sltrends/global_50yr.htm?stnid=680-140
And obviously, looking at the moving 50 yr trends for Auckland and Sydney (or anywhere else), there IS NO typical 0.019 mm yr-2 accelerarion. There’s BOTH accelerations and decelerations in the data.
The Church and White rationale is hogwash.
>”I get a max of 295mm This is a long way short of the 340mm quoted from the paper”
What I mean is that I can’t re-create the range given in the paper
I will write more on this over the weekend
Most absurd in the context of the Church and White rationale:
Variation of 50-Year Mean Sea Level Trends 500-041 Mumbai/Bombay, India
-0.86 mm/yr centred 1970, +2.61 mm/yr centred 1930.
Fremantle almost as silly: 1.36 1985, 0.02 1970, 2.37 1935.
Averaging data like this is nuts. There IS NO “global mean sea level” – rise or fall.
>”What I mean is that I can’t re-create the range given in the paper”
Ah, thanks. Your 295mm is your upper bound which is only just within the TAR lower bound of 280mm.
But you’re up against “consistent with” Andy. When stated in a climate change context, that means “within cooee”.
[Simpon] >” I see there was an update of the [C&W2006] paper in 2011: [C&W2011] which estimates the acceleration at 0.009 ± 0.004 mm year−2
Ok, so the previous “global” acceleration has decelerated apparently:
0.013 mm yr-2, C&W2006 (0.019 max),
0.009 mm yr-2, C&W2011
What if in the next update (not by C&W obviously – laid off) a deceleration is reported i.e. negative (-) acceleration ?
And again, even C&W’s updated and minimal “global” acceleration (0.009 mm yr-2) does NOT apply anywhere in the world – not any tide guage anywhere.
[Simon] >”This [C&W2011] would put the 21st century sea level rise of sea level at 34.8 cm by my estimation.”
Either Simon’s or Andy’s calcs are wrong, Simon is getting greater rise from lessor acceleration (348mm, 0.009 mm yr-2) than Andy is from greater acceleration (265mm, 0.019 mm yr-2)
s(t) = v t + (1/2) a (t^2), where v = linear trend at start, a = acceleration, and s(t) = sea level at time t
For a = 0.009 mm yr-2 (Simon)
After 100 years, SLR increase = 170mm + 1/2 * 0.009 * 100^2 = 215mm (Simon was incorrect with 348)
For a = 0.019 mm yr-2 (Andy)
After 100 years, SLR increase = 170mm + 1/2 * 0.019 * 100^2 = 265mm (Andy was correct)
Simon’s calc was incorrect by 133mm. I hope he is not a math teacher, or a SLR pundit.
Also, C&W2011’s 215mm rise after 100 yrs is somewhat underwhelming. And nowhere near TAR (“280 to 340 mm”).
>”Simon’s calc [for C&W2011] was incorrect by 133mm”
C&W2011 states:
So for V t = 190 mm and a = 0.009 mm yr-2
After 100 years, SLR increase = 190mm + 1/2 * 0.009 * 100^2 = 235mm
Simon, if he used V t = 190 mm/yr (?), is still incorrect by 113mm.
And again, C&W2011’s 235mm rise after 100 yrs is still underwhelming even accounting for recent shorter term fluctuation in the “global” mean.
I note that C&W2011 does not make a 100 yr projection with their acceleration reduced from that of C&W2006.
Not surprising when it only works out at 235mm (yawn), even with the heroic assumption that the acceleration will continue unabated and starting with the recent rate (1.9 mm/yr) assuming that wont go the other way either.
But C&W2011 appear unconvinced that recent rates are anything to go by (page 599 pdf):
Figure 8 (page 800 pdf and link below) is definitely worth a look (for chuckles):
Fig. 8 Linear trends in sea level over successive 16 year periods for the yearly averaged reconstructed sealevel
data. The trend from the satellite altimeter data are shown at the end of the time series
http://www.skepticalscience.com/pics/ChurchandWhite2011-LinearTrends.png
There is NO typical rate of “global” SL rise whatsoever. And obviously no human “fingrprint”.
But in the absence of C&W2011’s WAG, lets go for the extreme case projection using the most untypical and briefest but most recent “nearly 3 mm year-1”. Call it 3mm/yr or 300mm:
For V t = 300 mm and a = 0.009 mm yr-2
After 100 years, SLR increase = 300mm + 1/2 * 0.009 * 100^2 = 345mm
That’s well wihin TAR’s “280 to 340 mm” at the wildest stretch I can muster. And close to Simon’s 348mm i.e. he probably used V t = 3 mm/yr.
But only by 16 yr window and not applicable ANYWHERE in Australasia going by 50 yr window. From upthread:
50 yr trends
Auckland: 0.52 mm/year centred 1985, 2.18 mm/yr centred 1950
Sydney: 0.78 mm/yr centred 1985, 1.6 mm/yr centred 1950
Applied to Auckland:
V t = 52 mm and a = 0.009 mm yr-2
After 100 years, SLR increase = 52mm + 1/2 * 0.009 * 100^2 = 97mm
Cal it 100mm. And yawn again.
>”Applied to Auckland”
For chuckles. But obviously inappropriate because the claimed “global” acceleration is NOT evident in the Auckland data (or Sydney data):
Variation of 50-Year Mean Sea Level Trends 690-002 Auckland II, New Zealand
http://tidesandcurrents.noaa.gov/sltrends/global_50yr.htm?stnid=690-002
Variation of 50-Year Mean Sea Level Trends 680-140 Sydney, Fort Denison 1 & 2, Australia
http://tidesandcurrents.noaa.gov/sltrends/global_50yr.htm?stnid=680-140
“There is ……considerable variability in the [global] rate” – C&W2011.
Well yes, there is. Moreso regionally. Aucklands most recent 50 yr trend is 1/4 of what it was in 1950.
These are my calculations based on the Church and White SLR assumptions
That is, an initial SLR velocity of 1.7mm yr-1 +- 0.3 mm yr-1
and an acceleration of 0.013mm yr-2 +- 0.006 yr-2
The numbers quoted in the paper are a range 280-340mm
Usng the formula
SLR(t) = vt + 0.5a*t*t
where t = time in years
v = initial SLR velocity (1.7+-0.3)
a = acceleration ( 0.013mm yr-2 +- 0.006 yr-2 )
We can deduce three outcomes at least
Min: 205mm
Mean: 235mm
Max: 265mm
If I, for sake of argument, double the acceleration parameter, I get the output:
Min: 240mm
Mean: 300mm
Max: 360mm
The paper’s outcome seems to more closely resemble the doubled acceleration parameter. but not exactly
It is nowhere near the first set of calculations
EDIT – just to add that I haven’t taken into account the error bars in initial SLR velocity bit this is a simple calculation
>”The paper’s outcome seems to more closely resemble the doubled acceleration parameter. but not exactly”
Odd. Possibilities I can think of:
1) C&W2006 neglected the “half” factor, even then a questionable calc result.
2) Peer review didn’t check the application of the formula or the arithmetic i.e. C&W are incorrect but peer review didn’t pick it up.
3) C&W’s calc is different, for some inexplicable reason, than what they have divulged in their paper.
4) Given 3) perhaps, C&W’s result cannot be replicated from the paper’s details by anyone else.
I note C&W2011 did NOT update their C&W2006 100 yr projection using V t = 190 mm and a = 0.009 mm yr-2 (see upthread). This gives 235mm which corresponds EXACTLY with your C&W2006 “Mean: 235mm” Andy.
So changing V t UP and a DOWN just ends up with exactly the same result after 100 years.
>”345mm. That’s well wihin TAR’s “280 to 340 mm” at the wildest stretch I can muster. And close to Simon’s 348mm i.e. he probably used V t = 3 mm/yr”
If so, Simon\s “estimation” is NOT in accordance with either C&W2006 or C&W2011.
>”So changing V t UP and a DOWN just ends up with exactly the same result after 100 years.”
In other words, if C&W2011 had redone their projection they would have immediately realised there was something wrong with their C&W2006 calc.
Or (cynic’s explanation) perhaps they did, and that is why the updated projection is missing from C&W2011.
Should be:
>”345mm. That’s [above] TAR’s “280 to 340 mm” at the wildest stretch I can muster
Out of interest, I calculate the acceleration required to produce 1.0m of SLR in 100 years at 0.166mm yr-2
This is about 13 times the rate quoted in C&W 2006
‘1959 Paper Shows Most Warming Before 1945 …Arctic Warmed 7.7°C, Sea Level Rose 8 mm/yr’
By P Gosselin on 22. May 2016
[…]
Sea level rose 8 mm/year between 1930 – 1948
What follows are some of the details of this dramatic early 20th century warming as documented by Princeton geologist Dr. Erling Dorf, a veritable expert on the subject. Notice from the summaries provided below that sea levels were observed to be rising at a rate of about 8 mm/year between 1930 and 1948 (6 inches in 19 years), which is more than double today’s modeled satellite altimetry rate (3.2 mm/year).
These early 20th century temperature and CO2 trends beg the question: What were the physical mechanisms that caused this dramatic global-scale warming, since anthropogenic CO2 emissions were both low (~1 GtC/year) and stable during this period?
Summary of the 1900 to 1950 warm period as described in Dr. Dorf’s (1959) “CLIMATIC CHANGES OF THE PAST AND PRESENT”.
# A 14°F (+7.7°C) warming in the Arctic (North Pole region) between the early 1900s and 1950, with ice-free ports 7 months out of the year rather than the mere 3 months per year that were common at the turn of the century.
# A 5°F (+2.8°C) warming in Antarctica.
# “Catastrophic” and “violent” wasting away of glaciers, with Muir Glacier retreating 2 miles (3.2 km) in 10 years.
# A snow line rise by 2700 feet (823 meters) in the Peruvian mountains.
# A 6-inch (15 cm) rise in sea level between 1930 and 1948, a rate of about 32 inches (+80 cm) per century and 8 mm/yr (more than double today’s alleged rate per satellite altimetry [3.2 mm/yr]). A 600% increase in the rate of sea level rise in the 1920s.
# Agricultural crop lines shifted 50 to 100 miles (80 to 161 km) northward, with 10-day longer growing seasons.
# Tree lines moved 65 feet (20 meters) up the mountains in Sweden.
# Many birds and mammals extended their habitats northwards; about 25 species of birds advanced from the south up into a warmer Greenland; codfish replaced seals along the coasts of Greenland, which led “Greenland Eskimos” to switch to cod-fishing rather than seal-hunting.
Excerpts from Dr. Erling Dorf, 1959 [hotlink]:
CLIMATIC CHANGES OF THE PAST AND PRESENT
Continues>>>>>>
http://notrickszone.com/2016/05/22/1959-paper-shows-most-warming-before-1945-arctic-warmed-7-7c-sea-level-rose-8-mmyr/#sthash.eW9yKd7x.dpbs
# # #
The Auckland and Sydney tide guages upthread exhibit the early 20th rise. Recent SLR is negligible when compared.
Saturday’s editorial in The Press:
http://www.stuff.co.nz/the-press/opinion/80453901/editorial-new-zealand-needs-to-be-better-prepared-for-worsening-coastal-erosion
‘2015 Updated NOAA Tide Gauge Data Shows No Coastal Sea Level Rise Acceleration’
Guest essay by Larry Hamblin / May 28, 2016
https://wattsupwiththat.com/2016/05/28/2015-updated-noaa-tide-gauge-data-shows-no-coastal-sea-level-rise-acceleration/
H/t Andy. Synopsis:
Excellant essay and graphics by Larry Hamblin. Good to see recouse to NOAA’s 5 yr moving 50 yr trend analysis of tide guages from the Tides and Currents website. Immediately shuts down any notion of “acceleration”.
“Christchurch’s coastal cock up: review panel padded with climate deniers”
http://hot-topic.co.nz/christchurchs-coastal-cock-up-review-panel-padded-with-climate-deniers/
Just skimmed over T&T’s report to CCC seeing this wil be topical for a while:
REPORT Christchurch City Council = Effects of Sea Level Rise for Christchurch City
Tonkin & Taylor Ltd
November 2013
https://www.ccc.govt.nz/assets/Documents/Environment/Land/EffectsOfSeaLevelRiseForChristchurchCity.pdf
1) Just ONE scenario (1m rise by 2115)
2) Except, Table 4-8 Summary of tidal compartment and mouth width changes with sea level rise, has 3 scenarios: 0.2, 0.5, and 1m.
3) Figure 2-1 Projections of future global mean sea level rise and observations of past sea level rise (source: MfE, 2008), shows Port of Auckland mean annual sea level vs global tide guages and satellites.
The illusion is created that Auckland conforms to a skewed global average. It certainly does not. The series ends at 2000, there’s been one and a half decades of data since then. The accompanying text states (page 14):
In the case of Auckland, that is entirely false. Here’s Auckland:
Variation of 50-Year Mean Sea Level Trends 690-002 Auckland II, New Zealand
http://tidesandcurrents.noaa.gov/sltrends/global_50yr.shtml?stnid=690-002
The rate has been nowhere near 1.9 mm/yr since the mid 20th century. Current 50 yr trend 0.52 mm/yr.
Should be:
The rate has been nowhere near [1.8] mm/yr since the mid 20th century. Current 50 yr trend 0.52 mm/yr.
“Just one scenario”:
and this is why we need statistical expertise, but the choice of Kesten Green has ruffled some feathers.
Meanwhile, here is the Sat. Press Editorial that implies that the peer review process is a waste of time:
http://www.stuff.co.nz/the-press/opinion/80453901/editorial-new-zealand-needs-to-be-better-prepared-for-worsening-coastal-erosion
>”the choice of Kesten Green has ruffled some feathers”
I can see why:
Dr Kesten Green. Research – Highlights
evidence-based forecasting methods,survey research methods,forecasting decisions; the effects of role, interaction, and conflict on decision making; forecasting for negotiations and strategy in business and warfare,judgmental forecasting methods; the use of analogies in forecasting,forecasting for public policy
http://people.unisa.edu.au/Kesten.Green
# # #
“Evidence-based” and “judgmental” forecasting methods would be anathema in certain circles.
But unverified climate models, incapable of mimicing current climate, primed with outlandish input, generating insane output, violating thermodynamics laws, now that’s reliable forecasting methodology.
One of my Dip Bus papers was Managerial Economics but not so much on forecasting (that I remember anyway). For background on where Kesten Green is coming from given his tutoring:
Kesten Green’s teaching & student supervision – Managerial economics, Forecasting methods
Example (not UniSA): Managerial Economics = Methods of Demand forecasting
Complex Statistical Methods [among others]
1) Time series analysis or trend method: Under this method, the time series data on the under forecast are used to fit a trend line or curve either graphically or through statistical method of Least Squares. The trend line is worked out by fitting a trend equation to time series data with the aid of an estimation method. The trend equation could take either a linear or any kind of non-linear form. The trend method outlined above often yields a dependable forecast
The advantage in this method is that it does not require the formal knowledge of economic theory and the market, it only needs the time series data. The only limitation in this method is that it assumes that the past is repeated in future. Also, it is an appropriate method for long-run forecasts, but inappropriate for short-run forecasts. Sometimes the time series analysis may not reveal a significant trend of any kind. In that case, the moving average method or exponentially weighted moving average method is used to smoothen the series
http://notesandassignments.blogspot.co.nz/2012/10/methods-of-demand-forecasting.html#!/2012/10/methods-of-demand-forecasting.html
# # #
I hear – “But, BUT, physics, carbon dioxide, 3.4 mm/yr, acceleration, etc……….”
Re 3.4 mm/yr, CU has afancy new graph:
2016_rel2: Global Mean Sea Level Time Series (seasonal signals removed)
http://sealevel.colorado.edu/
Over the last year the change was a 70 to 80 jump then stuck around 80ish:
2015.1123 69.754
2015.1395 75.024
2015.1666 74.856
2015.1938 68.329
2015.2209 66.114
2015.2481 71.206
2015.2752 72.673
2015.3024 75.731
2015.3295 75.455
2015.3567 68.639
2015.3838 67.778
2015.4110 72.002
2015.4381 74.544
2015.4653 78.387
2015.4924 78.014
2015.5196 72.954
2015.5467 72.866
2015.5739 74.673
2015.6010 77.439
2015.6281 78.334
2015.6553 79.289
2015.6824 77.957
2015.7096 75.155
2015.7367 76.057
2015.7639 80.739
2015.7910 82.489
2015.8182 82.458
2015.8453 77.328
2015.8725 74.158
2015.8996 78.856
2015.9268 80.967
2015.9539 79.268
2015.9811 75.785
2016.0082 71.955
2016.0354 74.305
2016.0625 80.676
2016.0897 79.783
2016.1168 82.429
2016.1440 80.436
It will be interesting to watch CU MSL now that El Nino is giving way to La Nina.
Also from the CU page linked:
Our Publications
‘Uncovering an anthropogenic sea-level rise signal in the Pacific Ocean’
Hamlington et al (2014)
http://sealevel.colorado.edu/content/uncovering-anthropogenic-sea-level-rise-signal-pacific-ocean
Abstract [abridged]
“The resulting pattern of regional sea-level rise uncovered in the tropical Pacific Ocean is explained in part by warming in the tropical Indian Ocean, which has been attributed to anthropogenic warming9. This study represents one of the first attempts at linking the sea-level trend pattern observed by satellite altimetry to anthropogenic forcing.”
Totally bogus. One basin’s OHC (Indian) is attributed to anthropogenic warming (huh?). This apparently “explains” sea levels in a second basin (Pacific). A more convoluted stretch would be hard to compile.
A more recent paper, Palanisamy et al, sees it rather differently:
‘Is anthropogenic sea level fingerprint already detectable in the Pacific Ocean?’
Palanisamy et al (2015)
http://iopscience.iop.org/article/10.1088/1748-9326/10/8/084024/pdf
Abstract [abridged]
Weshow that subtraction of the IPO contribution to sea level trends through the method of linear regression does not totally remove the internal variability, leaving significant signal related to the non-linear response of sea level to El Niño Southern Oscillation (ENSO). In addition, by making use of 21 CMIP5 coupled climate models, we study the contribution of external forcing to the Pacific Ocean regional sea level variability over 1993–2013, and show that according to climate models, externally forced and thereby the anthropogenic sea level fingerprint on regional sea level trends in the tropical Pacific is still too small to be observable by satellite altimetry.
Kesten Green is associated with “extreme right wing” groups like Heartland (according to Gareth) plus has written papers with “extreme right wing climate denier” Willie Soon.
He has no experience in climate change, sea level rise or coastal hazards .
However, according to The Press, we don’t need that expertise, because the public no better anyway
“Know better”. I should say
>”the choice of Kesten Green has ruffled some feathers”
This explains the offense:
‘Research on Forecasting for the Manmade Global Warming Alarm’
Testimony to Committee on Science, Space and Technology Subcommittee on Energy and Environment
on “Climate Change: Examining the processes used to create science and policy” – March 31, 2011
Professor J. Scott Armstrong, University of Pennsylvania,
with Kesten C. Green, University of South Australia,
and Willie Soon, Harvard-Smithsonian Center for Astrophysics
!
Abstract
The validity of the manmade global warming alarm requires the support of scientific forecasts of (1) a
substantive long-term rise in global mean temperatures in the absence of regulations, (2) serious net
harmful effects due to global warming, and (3) cost-effective regulations that would produce net
beneficial effects versus alternatives policies, including doing nothing.
Without scientific forecasts for all three aspects of the alarm, there is no scientific basis to enact
regulations. In effect, the warming alarm is like a three-legged stool: each leg needs to be strong. Despite
repeated appeals to global warming alarmists, we have been unable to find scientific forecasts for any of
the three legs.
We drew upon scientific (evidence-based) forecasting principles to audit the forecasting
procedures used to forecast global mean temperatures by the Intergovernmental Panel on Climate Change (IPCC)—leg “1” of the stool. This audit found that the IPCC procedures violated 81% of the 89 relevant forecasting principles.
[Unable to copy…….audit of 2 papers written to support regulation] —leg “3” of the stool. On average, the forecasting procedures violated 85% of the 90 relevant principles.
The warming alarmists have not demonstrated the predictive validity of their procedures. Instead,
their argument for predictive validity is based on their claim that nearly all scientists agree with the
forecasts. This count of “votes” by scientists is not only an incorrect tally of scientific opinion, it is also,
and most importantly, contrary to the scientific method.
We conducted a validation test of the IPCC forecasts that were based on the assumption that there
would be no regulations. The errors for the IPCC model long-term forecasts (for 91 to 100 years in the
future) were 12.6 times larger than those from an evidence-based “no change” model.
Based on our own analyses and the documented unscientific behavior of global warming
alarmists, we concluded that the global warming alarm is the product of an anti-scientific political
movement.
Having come to this conclusion, we turned to the “structured analogies” method to forecast the
likely outcomes of the warming alarmist movement. In our ongoing study we have, to date, identified 26
similar historical alarmist movements. None of the forecasts behind the analogous alarms proved correct.
Twenty-five alarms involved calls for government intervention and the government imposed regulations
in 23. None of the 23 interventions was effective and harm was caused by 20 of them.
Our findings on the scientific evidence related to global warming forecasts lead to the following
recommendations:
1. End government funding for climate change research.
2. End government funding for research predicated on global warming (e.g., alternative energy;
CO2 reduction; habitat loss).
3. End government programs and repeal regulations predicated on global warming.
4. End government support for organizations that lobby or campaign predicated on global
warming.
http://www.forecastingprinciples.com/images/stories/pdf/ags2011congress.pdf
About ForPrin (see pdf link to the Armstrong, Green,and Soon paper above)
Foercasting Principles – Evidence-nased Forecasting
This Website has been visited 11,583,962 times.
Objectives
The Forecasting Principles site summarizes all useful knowledge about forecasting so that it can be used by researchers, practitioners, and educators. (Those who might want to challenge this are invited to submit missing information.) This knowledge is provided as principles (guidelines, prescriptions, rules, conditions, action statements, or advice about what to do in given situations).
This site describes all evidenced-based principles on forecasting and provides sources to support the principles. The primary source is Principles of Forecasting, a comprehensive summary of forecasting knowledge which involved 40 authors and 123 reviewers.
Sponsors
The Forecasting Principles site is provided as a public service by the International Institute of Forecasters. A companion site provides information about the Institute, the International Symposium on Forecasting, the International Journal of Forecasting, and Foresight: The International Journal of Applied Forecasting. Support for this site was initially provided by the Marketing Department of the Wharton School.
Directors
Forecastingprinciples.com was created in 1997 by:
Dr J. Scott Armstrong, Professor at the Wharton School, University of Pennsylvania, Philadelphia, PA 19104, founded ForPrin.com in 1997. He has been a Director since that time.
Scott is included in a 2010 list of the 25 Most Famous College Professors Teaching Today.
Dr Kesten C. Green of the University of South Australia Business School and Ehrenberg-Bass Institute, joined him in 2006 as co-director.
Kesten developed the simulated interaction and structured analogies methods for forecasting decisions in conflict situations such as business competition, union-management disputes, mergers and acquisitions, diplomacy, terrorism, and warfare. He champions the importance of using evidence-based forecasting methods to guide public policy decisions, such as for climate change.
Kesten is a co-originator of the Golden Rule of Forecasting [hotlink]. His findings on superior predictive validity of sophisticatedly simple forecasting methods over complex ones challenge current enthusiasms for big data analytics.
Kesten hasn’t always been an academic, but forecasting has always been important for him. Before joining the University of South Australia late in 2009, he was a founder and director of a twice-weekly horse race forecasting publisher, an economic forecasting and consulting house, and a market research business.
http://www.forecastingprinciples.com/index.php/about-121?id=34
From ForPrin Home page:
Occam’s razor and forecasting climate
Scott Armstrong’s notional bet with Al Gore provides evidence that the IPCC’s preference for complexity has increased the size of forecast errors by as much as 45% over a seven year period. (Armstrong is represented by forecasts from the simple no-trend model, and Gore by the IPCC model “business as usual” projected warming rate of 0.03°C per annum.) Earlier, Green, Armstrong, and Soon’s (2009) validation study found that the “business as usual” projection from the IPCC’s complex forecasting models increased the size of forecast errors by seven times relative to the simple no-change model for the period of exponentially increasing atmospheric CO2 from 1851 to 1975.
A longer version of this essay is available from the popular climate change site, Watt’s Up With That?, here.
Kesten and Scott’s conference paper abstract and slides are available from ResearchGate, here.
Their paper, “Simple versus complex forecasting: The evidence” and their Simplicity Checklist are available from the Simple-Forecasting.com pages of the ForecastingPrinciples.com (ForPrin.com) website. (You can do your own ratings of the IPCC procedures, to check if your ratings might lead to a different conclusion.) The original Green, Armstrong, and Soon validation study of IPCC forecasting is available here.
http://www.forecastingprinciples.com/index.php/630-occam-s-razor-and-forecasting-climate
Forecasting climate in Paris: Ignoring the Golden Rule
The global political and media elites descending on Paris for talks on climate policy might want to consider the Golden Rule of Forecasting.
The Golden Rule derives from many decades of experimental research on forecasting across diverse fields and all kinds of forecasting problem. The Golden Rule of Forecasting “requires forecasters to be conservative by forecasting in a way that is consistent with cumulative knowledge about the situation and about forecasting.”
Ignoring the Golden Rule has important practical consequences: The size of forecast errors is typically increased by more than 40%.
The Paris climate talks are predicated on the dangerous manmade global warming scenarios and projections of the UN’s Intergovernmental Panel on Climate Change (IPCC). These projections are being treated as forecasts by the policy makers and media attending the Paris talks.
In anticipation of the Paris talks, Scott Armstrong and Kesten Green delivered a paper at this year’s International Symposium on Forecasting assessing whether the IPCC’s procedures are consistent with the Golden Rule. They found that the IPCC’s procedures violated all 20 of the relevant Golden Rule guidelines.
The abstract and slides of their paper, titled “Are dangerous warming forecasts consistent with the Golden Rule?” are available from ResearchGate, here. A supporting flyer is available, here.
http://www.forecastingprinciples.com/index.php/629-forecasting-climate-in-paris-ignoring-the-golden-rule
>”It will be interesting to watch CU MSL now that El Nino is giving way to La Nina.”
Here’s an animation of Jason-2 sea level residuals Dec 6 2015 – May 22 2016 courtesy of Bob Tisdale:
https://bobtisdale.files.wordpress.com/2016/05/animation-11.gif
Gives an idea of what is up or down where and what the progression has been up to the end of El Nino.
>”The illusion is created that Auckland conforms to a skewed global average. It certainly does not. The series ends at 2000, there’s been one and a half decades of data since then” [Figure 2-1 T&T CCC Report]
Similar situation with a peer-reviewed paper from 2012 with data to end of 2009:
‘The sea levels are now reducing in the “hotspots of acceleration” of Washington and New York’
Guest essay by Giordano Bruno / May 29, 2016
Hopefully everybody remember Sallenger’s “hot spots” of sea level acceleration along the East Coast of the US.
Asbury H. Sallenger Jr, Kara S. Doran & Peter A. Howd, Hotspot of accelerated sea-level rise on the Atlantic coast of North America, Nature Climate Change 2, 884–888 (2012), doi:10.1038/nclimate1597
This was one of the many examples of bad science misinterpreting the sea level oscillations by cherry picking the time window.
As 6 more years of data have been collected, let see if the hotspots are now the “hottest on record” or if they have cooled down.
[…]
Which is then the novelty of the last 6 years of data? Since December 2009, the sea levels have declined in both Washington DC and The Battery NY, -3.3 mm/year in Washington DC and -10.7 mm/year in The Battery NY.
It seems that immediately after December 2009, the last month of data considered by Sallenger & co. in their June 2012 paper, corrected online June 2013 with the publishing in the supplementary of the actual numbers, a positive phase of the oscillations has been replaced by a negative phase.
See graphs>>>>>
https://wattsupwiththat.com/2016/05/29/the-sea-levels-are-now-reducing-in-the-hotspots-of-acceleration-of-washington-and-new-york/
Gareth says: May 31, 2016 at 11:47 am
“How on earth did Green get on the list? If it was at your suggestion, who pointed you at him? He’s hardly top of any list of statistical experts – especially when there are much more credentialed NZ-based people on the short list!”
http://hot-topic.co.nz/christchurchs-coastal-cock-up-review-panel-padded-with-climate-deniers/#comment-47710
# # #
Err,,, Green’s not just a statistician and he’s rather more than just a managerial economist. Gareth might aquaint himself with Green’s standing in the International Institute of Forecasters for example (Director 2010 to 2014):
International Institute of Forecasters https://forecasters.org/
And then he might check out Green’s CV:
Dr Kesten C. Green – Curriculum Vitae
http://www.kestencgreen.com/kgcv.pdf
Green may be offensive to Gareth but apparently not elsewhere (from CV page 5):
Consulting clients (selected from more than 60)
Alaska Department of Natural Resources
Department of Defense (The Pentagon)
Defense Threat Reduction Agency’s Advanced Systems and Concepts Office (DTRA/ASCO)
National Security Agency (NSA)
His CV runs to 6 pages. His education was in New Zealand which implies that he is a New Zealander (CV page 6):
Education
2000 to 2003: PhD candidate at Victoria Management School, Victoria University of Wellington. Thesis on
forecasting decisions in conflicts accepted in September 2003; degree conferred 10 December.
1998 to 2000: Part-time Master of Management Science (Decision Sciences) student at Victoria University;
switched from Masters program to full-time PhD program after starting thesis.
Harry Twinotter says: May 30, 2016 at 8:28 pm [Hot Topic]
“So NZ does not have enough climate change deniers, and one has to be imported from Aus? Credit to NZ.”
http://hot-topic.co.nz/christchurchs-coastal-cock-up-review-panel-padded-with-climate-deniers/#comment-47703
Well not really Harry (but credit to NZ, yes), more like Australia imported Keston from New Zealand, or New Zealand exported him to Australia. He’s just re-visiting his roots, as he’s done several times (see CV above).
“His CV runs to 6 pages.”
Wow. Nice work.
>”The March 2016 Monthly Data Report (at right) from the long-standing Australian project, the Pacific Sea Level Monitoring Project (PSLMP),”
That’s this graph from post:
https://www.climateconversation.org.nz/wp/wp-content/uploads/2016/05/mthly-sea-levels-1992-march-2016.jpg
From this report:
http://www.bom.gov.au/ntc/IDO60101/IDO60101.201604.pdf
Looking at the enlarged graphs of 20 years of data from Pacific Island tide guages, the notion that the sea is rising, and dangerously, is just plain silly.
>”….over the last 22 years, sea level in the Solomon Islands has risen at an average 4.6 mm per year, for a total rise of 101 mm”
The rates are on page 12: Table 1. Updated overall rates of sea level movement based on SEAFRAME data from installation through April 2016.
The rate of 4.6 mm/yr is entirely misleading (I call bogus). That rate, and just about every other rate on Table 1, is skewed by the years 1996, 1997, and 1998 i.e. a very short period of the series distorts an uncharacteristic (i.e. unrepresentative) linear trend.
In other words, the linear trend does NOT resemble the data – it is statistically inappropriate.
The trajectory of the data, in almast every case, is dead FLAT i.e. fluctuating about the mean but not trending up or down. Contrary to the rates on Table 1, sea levels are NOT rising in any of those 12 tide guages.
It’s not just journalists who are distorting sea levals.
More breathless indignation from Cindy Baxter
https://coalactionnetworkaotearoa.wordpress.com/2016/05/30/chch-council-should-drop-climate-deniers-from-expert-review-panel/
I will buy you, Cindy, and Gareth, a drink sometime. It really isn’t that bad
For the record:
I’m inclined to think there are plenty of people around NZ who, like Arnold, if they were sufficiently motivated could rip T&T’s report to shreds. Arnold has obviously already been there and done that hence his view the review is unnecessary.
I think it best that “statistically flawed, based on outdated law, and exaggerated the effects of sea-level rise” is formalized.
Baxter:
Yes of course Cindy, “proper” IPCC-aligned “climate” scientists who wouldn’t dare commit the heresy of an objective review of thier pal’s IPCC “consensus” work which even though explicitly advised against by the providers forms the basis of the only scenario considered in the T&T study for CCCC (1m and RCP8.5) and the responsibility, or irresponsibility, of that approach. No-one else could possibly have that “expertise”.
On the bright side, Baxter provides some much needed attention to alternative approaches:
With 5 year reviews too. The more that is known about the North Carolina turnabout (and Eurobodalla Shire Council and Shoalhaven City Counci, NSW) the better.
Andy and Richard C,
It’s an inspiration, reading this. You’re both doing valuable work in a practical arena, opposing the invisible bias that infects our thinking around topics touching climate. May the gods grant you long life.
RT, just uncovering what is hidden in plain sight. Basically stuff the IPCC, and their adherents, would rather nobody ever read.
Thomas says: May 31, 2016 at 8:41 pm
“If their findings and predictions do not match with what you wish they would report, perhaps first question your own methods of interpretation. And you know very well that forecasting a linear SLR trend as Mr. Jowsey suggests on Facebook is entirely unscientific based on what we know about the trend.”
http://www.scientificamerican.com/article/new-data-reveal-stunning-acceleration-of-sea-level-rise/
http://hot-topic.co.nz/christchurchs-coastal-cock-up-review-panel-padded-with-climate-deniers/#comment-47712
# # #
“What we know about the trend” where? And when? Thomas’ link reads:
A case of high res data on the end of low res data (again). No mention of an “acceleration” by the authors, that’s just an ignorant Climate Central headline. The “global” per century rate they found was not an “acceleration” by mathematical/physics definition (which Thomas SHOULD know).
And there’s no relation whatsoever between industrialization i.e. CO2 emissions, and tide guage data at Nth Carolina or anywhere else. Neither is there any relationship between tide guage data from North Carolina and tide guage data anywhere else in the world. NC data is specific to the NC coast, that is wht they threw out IPCC-based policy. Even the 5 tide guages on the NC coast have different coastal conditions and rates (see below), another reason why NC threw out IPCC-based policy.
There’s only a vague relationship between NC and SC:
Variation of 50-Year Mean Sea Level Trends 8658120 Wilmington, North Carolina
what we know about the trend
Variation of 50-Year Mean Sea Level Trends 8665530 Charleston, South Carolina
http://tidesandcurrents.noaa.gov/sltrends/50yr.htm?stnid=8665530
Then there’s the 5 NC TGs already mentioned:
North Carolina
8651370 Duck, (4.48 mm/yr)
8652587 Oregon Inlet Marina, [short series] (3.84 mm/yr)
8656483 Beaufort, (2.89 mm/yr)
8658120 Wilmington, (2.19 mm/yr)
8659084 Southport, [broken series] (2.00 mm/yr)
http://tidesandcurrents.noaa.gov/sltrends/sltrends_station.shtml?stnid=8652587
No “acceleration” and no typical rate when the range is 2 to 4.5 mm/yr.
And no “acceleration” in the long-running guages further up the eastern seaboard which show mid 20th century rates higher than latest and considerably lower in between:
Variation of 50-Year Mean Sea Level Trends 8574680 Baltimore, Maryland
http://tidesandcurrents.noaa.gov/sltrends/50yr.htm?stnid=8574680
Variation of 50-Year Mean Sea Level Trends 8518750 The Battery, New York
http://tidesandcurrents.noaa.gov/sltrends/50yr.htm?stnid=8518750
And nothing like Auckland either:
Variation of 50-Year Mean Sea Level Trends 690-002 Auckland II, New Zealand
http://tidesandcurrents.noaa.gov/sltrends/global_50yr.htm?stnid=690-002
Auckland NZ: 0.52 mm/yr, last 50 years
Wilmington, NC: 2.32 mm/yr. last 50 years
Auckland NZ: 1.29 mm/yr, entire series
http://tidesandcurrents.noaa.gov/sltrends/sltrends_global_station.htm?stnid=690-002
Wilmington, NC: 2.19 mm/yr., entire series
http://tidesandcurrents.noaa.gov/sltrends/sltrends_station.shtml?stnid=8658120
So, “based on what we know about the trend”, what’s the trend? where? and when?
1) Obviously a mathematical acceleration is out of the question anywhere.
2) Mike Jowsey’s approach is problematic but “scientific” once the appropriate location, length of location history, and length of location projection (given historical fluctuation) is identified.
3) Obviously Wilmington (and the NC coast) and Auckland are radically different from each other. Christchurch same i.e. “the trend” can only ever be in respect to individual specific locations; there is NO typical trend applicable across locations. And “the trend” must take into account the state of fluctuation at the time.
4) IPCC projections are not relevant at any coastal location anywhere in the world at present – it willtake decades, if ever, for any human “fingerprint” to emerge from natuaral fluctuation, see:
‘Is anthropogenic sea level fingerprint already detectable in the Pacific Ocean?’
Palanisamy et al (2015)
http://iopscience.iop.org/article/10.1088/1748-9326/10/8/084024/pdf
5) North Carolina’s 30 yr projection scenario approach (rise increase?, no change? flat? fall?), specific to each seperate TG, with 5 yearly reviews, is responsible non-overreaching policy.
RT, I’ve just sent a comment into spam. Too many links again I think perhaps.
Yeah, fixed. I’m up a bit late tonight.
That Scientific American article Thomas link to is just dreadful,
Where are the numbers? How much is this “stunning” acceleration in sea levels they refer to?
The Scoop press release is quite funny if it were not so serious.
You don’t get to do a peer review by questioning the science.
Yes really
Maybe Cindy is tacitly acknowledging that Tonkin and Taylor were told to use 0.4 m and 1.0 m sea level projections by the government
>”Variation of 50-Year Mean Sea Level Trends 8658120 Wilmington, North Carolina
what we know about the trend”
Duh, “what we know about the trend” should have been the link-to Wilmington, which is:
http://tidesandcurrents.noaa.gov/sltrends/50yr.htm?stnid=8658120
Wilmington NC is not a long-running site. The Battery NY, see upthread, begins in the 19th century, although there is missing data at the beginning of the 20th. “The trend” for each series is (with west coast and Auckland comparison):
2.84 mm/yr The Battery NY
2.32 mm/yr Wilmington, NC last 50 years
2.19 mm/yr Wilmington NC
1.94 mm/yr San Francisco
1.29 mm/yr Auckland NZ
0.95 mm/yr Los Angeles
0.52 mm/yr Auckland NZ last 50 years
So “based on what we know about the trend”, as Thomas puts it, what do we know about “the trend” and what is “the trend” ?
Obviously it depends on where, and when.
Baxter (for Coal Action Network Aotearoa):
This is wrong. There’s nothing that I can see in the T&T report in respect to “a sea level rise of around 40cm over the next 50 years”. The timeframe is.100 years only and a 1m rise.
Only in Table 4-8 (Avon-Heathcote Estuary – Summary of tidal compartment and mouth width changes with sea level rise), is there 3 scenarios: 0.2, 0.5, and 1m. But those are still in respect to a 100 year timespan, nothing about 50 years or 0.4m. If that scenario really is in the report somewhere it’s very well hidden. A pdf search for “50 years” or “0.4” comes up with nothing. The report states (page 12):
“The T&T original report was based on the results of the Second Assessment Report (1996), which suggested a sea level rise projection of 0.49 m by the year 2100.”
That’s as close as I can get.
SLR better get a wriggle on for 40cm by 2065. In linear terms that’s 8 mm/yr.
I think that the 0.4 m was part of the CCC policy docs, and I find it hard to keep track of which bit came from where
Whatever, it seems fairly clear that the numbers are directives from high up the food chain, so T&T were probably told what to do.
In any case, the usual suspects are getting in a lather about it all, and now that we have Trump to channel, it is easy to shrug these guys off.
We just need to build a wall.
Too easy
RC – “2) Mike Jowsey’s approach is problematic but “scientific” once the appropriate location, length of location history, and length of location projection (given historical fluctuation) is identified.”
To clarify, I was not the author. I.e., it was not my approach. I simply linked to, without comment, a Youtube presentation by ClimateSanity. If you think that their approach is problematic, that’s fine, but please don’t shoot the courier pigeon.
Link to presentation: https://www.youtube.com/watch?v=g-6aLN5EK1I&feature=share
Link to the CCRU post:
https://www.facebook.com/groups/ccrugroup/permalink/557475874412995/
Andy – “We just need to build a wall. ”
Correct. And who’s gonna pay for it?
The Mexicans are!
It is a shame that the activists are getting their grubby paws into the ChCh T&T review. If they end up changing the makeup of the panel to suit their agenda, then it isn’t going to end well.
The council were very careful not to get involved.
We need to be careful what we say folks. Facebook and Twiiter plan to outlaw “hate speech” within 24 hours.
http://www.frontpagemag.com/fpm/263026/twitter-and-facebook-vow-eliminate-hate-speech-robert-spencer
“Hate speech” includes being critical of Islamic Jihad, and one presumes, “climate denial”
Remind me again what “coal action network” has to do with people’s right to build conservatories by the beach in Christchurch?
“Remind me again…”
You climate deniers are all the same.
I deny that I am a denier.
That’s one for Bertrand Russell fans to muse over
Thomas writes at HT
There was I thinking that we were organising a scientific peer review. Gotcha!
meanwhile, CCC frizzles money away on electric cars
http://www.stuff.co.nz/the-press/news/80656807/clean-green-electric-car-fleet-overdue–deputy-mayor-vicki-buck
>”If you think that their approach is problematic, that’s fine, but please don’t shoot the courier pigeon.”
It was your promotion Mike so I just identified it with “Mike’s approach”. I do think it is sensible to defer to actual data and I’m not shooting you or the author of the graphics in any way. I’m carrying on from what has ensued as a result of your Facebook post mike.
This is what Thomas at Hot Topic made of it (replying to Andy):
Apparently this what the carrier pigeon dellivered according to Thomas, not me. So I’m then asking: what is “the trend” and what do “we know about the trend”.
This is what is problematic. I actually agree with Thomas to a degree (although his conception of “the trend” seems to include an “acceleration” for which there is no evidence in tide guages). What trend do you project linearly? Or by any other method?
I then state how such a projection, which can only be indicative and only for a relatively short timespan (i.e. 100 years is brainless), North Carolina’s 5 year reviews of 30 projections is sensible as I’ve already stated upthread:
I then state how I think such a projection would be “scientific” as Thomas demands:
In other words, you’ve got to get past the “problematic” part to see what the “scientific” solution is. The IPCC’s globally averaged projection is irrelevant to any specific tide guage at any locality anywhere in the world (as I’ve also previously stated – see 4) upthread). What is relevant when setting say, national or council guidelines, is to identify local conditions and history i.e. taking into account the state of fluctuation in order to make a realistic projection (also critical for human attribution – again see 4) upthread).This is now North Carolina’s approach in respect to the 5 tide guages on the NC coast.
The CCC sea level battle, and anywhere else, is over the singular use of IPCC projections (wildest-of-wild IPCC RCP8.5 in case of CCC) versus a consideration of ALL of the scenario possibilites and projection methodologies, and over sensible timespans.
The CCC approach is entirely deficient in this regard.
Thomas (as per Andy):
Amazing! Isn’t this the “conspiracy ideation” that Lewandowsky accuses “deniers” of?
And who does Thomas think he is? Stazi?
There’s no news of any conflict of interest between the individuals involved in the CCC process that I’m aware of (obviously different points of view but that’s not conflict). If there was it would be out in the open, hardly “behind closed doors”.
>”It is our collective business to know who is trying to influence political outcomes and why and who is paying for it too!”
OK, here’s one group for starters: Coal Action Network Aotearoa
Coal Action Network Aotearoa is obviously “trying to influence political outcomes”. Is it OK for them to do so by your standards Thomas?
There were quite a few different viewpoints represented in the reference group, and no one held back in expressing their views.
I put forward some names and was quite clear that some were considered in the “sceptic” category. I also put forward some names from the climate science establishment in NZ
I don’t really want to share this information and don’t think it adds any value.
Some people didn’t get chosen, for various reasons, some were self-expressed conflicts of interest
>”There were quite a few different viewpoints represented in the reference group, and no one held back in expressing their views.”
The reference group which did not include Thomas or Cindy Baxter of the Coal Action Network Aotearoa i.e. none of their business, as you put it at HT Andy.
All Thomas and Cindy want is IPCC-aligned and motivated individuals who would rubber stamp an IPCC-based report. They don’t seem to understand the concept of an independent “expert review”. This is not a pal review by pal peers that they are used to and operates in climate science (think Climategate).
In other words, outside expertise with transferrable and appropriate skills and scope. This is anathema to Thomas and Cindy.
>”outside expertise with transferrable and appropriate skills and scope”
I would add that this is the wider community coopting said skills and scope to critique the work of a relatively smaller group with a limited approach.
Something that has been lacking in regard to IPCC assessments and the flow on from them.
If applied heat qualified specialists wih a working knowledge of the laws of thermodynamics, 2nd Law in particular, turned their attention to the radiative and thermo details of the AGW conjecture a.k.a. man-made climate change, the science would be settled rather quickly. The conjecture would be shredded.
I was quite keen to have a statistician on the peer review panel, and several names were suggested.
Maybe the government, or Facebook, Twitter, or whoever is policing our language and behaviour these days, should produce a list of politically acceptable people to advise us. You know, just in case we accidentally suggest a “denier”
We had better be quick folks, socialist utopia is almost here:
“Landmark California bill would allow prosecution of climate-change skeptics”
http://www.washingtontimes.com/news/2016/jun/2/calif-bill-prosecutes-climate-change-skeptics/
From the Coal Action Network Facebook page:
”
Cindy, Cindy Baxter, good on you for speaking publicly on 2 climate deniers being used as peer reviewers for the Christchurch climate model for sea level rise. I found it as an article in the Westport News. We have a climate denier on the West Coast Regional Council, his name is Cnr Birchfield, the one that was prosecuted for his goldmine running dirty and breaching consent condiions.”
Yeah good on you Cindy. We need to flush out all these evil deniers that don’t think catastrophic climate change and sea level rise is 100% certain
Send them to camps, build a wall…
Climate Science Debate Not Settled; Debate Still Needed
Friday, 3 June 2016, 12:43 pm
Press Release: New Zealand Climate Science Coalition
by Bryan Leyland MSc, FIEE(rtd), FIMechE, FIPENZ
Energy spokesman for New Zealand Climate Science Coalition
[…]
Sea level rise is reasonably well documented for the last hundred plus years from tide gauge records that show that it has been at a fairly steady rate in the region of 0.14 and 0.17 m per century. This is not unexpected given that we are still coming out of the Little Ice Age. Since the 1970s, sea levels have been measured by satellites that show a rate of rise of 0.32 m per century. No one is quite sure why the disparity exists. Some people believe it is because they are biased by mid-ocean sea level rise which does not affect the situation along shorelines. Neither record shows any sign of a recent and rapid increase in sea levels.
Sadly, this does not stop academics who specialise in computer models of the climate advising the Royal Society of New Zealand that sea levels are likely to rise rapidly and reach between 0.3 m and 1 m by 2100 – more than predicted by the U.N.Intergovernmental Panel on Climate Change (IPCC). Scientists with practical experience of sea level changes around New Zealand point out that the coastline is subsiding in some places and rising in others. The Royal Society advisers have ignored these movements and the slow rise in New Zealand sea levels over the last 100 years. Similar extreme predictions have been adopted by the Ministry of the Environment and are now being used by Councils to devalue coastal land and limit development near the sea. They have even predicted sea level rise in places where the land is rising from the sea!
A recent article claimed that sea levels in some Solomon Islands were rising rapidly because of global warming. It also claimed that the sea level at Tuvalu was rising and forcing people to flee. The reality is quite different: it is well-known that the islands in the Solomons are steadily sinking beneath the sea and the accurate tide gauges installed by the Australian government at Tuvalu in the 1990s show that there has been no significant increase in sea level. A study by a New Zealand academic showed that the land area of Pacific atolls is increasing. If it didn’t, then all the atolls in the ocean would have been drowned when the sea level rose at 3 m per century coming out of the last Ice Age.
More>>>>>>>
http://www.scoop.co.nz/stories/PO1606/S00031/climate-science-debate-not-settled-debate-still-needed.htm
# # #
The only voice in the media expounding on this that I know of.
Just scraping the surface. I think readers would be surprised at the degree of variation in tide guage and satellite data. Case in point: Fiigure 1a of this paper from up-thread:
‘Is anthropogenic sea level fingerprint already detectable in the Pacific Ocean?’
Palanisamy et al (2015)
http://iopscience.iop.org/article/10.1088/1748-9326/10/8/084024/pdf
Vast areas of sea level FALL in the Pacific. Doesn’t reconcile with the “rising seas” meme.
This article also appeared in Monday’s print edition of The Press, but without the “denier” bit in the headline
http://www.stuff.co.nz/the-press/news/80617955/climate-change-deniers-should-be-dropped-from-panel-group-says
There are some good comments in the Stuff article linked above
I spoke a bit too soon, the usual suspects have picked up their dole cheques and weekly supply of weed and are busy polluting the comments section with the usual lies about oil funding and “deniers”
“busy polluting the comments section”
Quick visit … see what you mean — nasty.
From the comments, people are one of two types
(1) You “accept the science” of catastrophic sea level rise and need to leave your home
(2) A “denier”
A bit tragic really, when all we want is a fair evaluation of the risks
You’ve already had them. Read FAR, SAR, TAR, AR4, AR5 … Why do you deny this? I mean, that’s all we’re going to get from these people, who are delighted that there’s an imminent catastrophe.
The strange thing is that there is a fairly vocal group of local residents who believe one metre SLR is “conservative”, yet they are planning to remain by the coast.
I really don’t understand human logic sometimes
“Aestheticism and radicalism must lead us to jettison reason, and to replace it by a desperate hope for political miracles. This irrational attitude which springs from intoxication with dreams of a beautiful world is what I call Romanticism. It may seek its heavenly city in the past or in the future; it may preach ‘back to nature’ or ‘forward to a world of love and beauty’; but its appeal is always to our emotions rather than to reason. Even with the best intentions of making heaven on earth it only succeeds in making it a hell – that hell which man alone prepares for his fellow-men.”
― Karl Popper, The Open Society and its Enemies
>“Aestheticism and radicalism must lead us to jettison reason, and to replace it by a desperate hope for political miracles”
Just watched a Bernie Sanders speech. Epitomizes the Popper quote to a “T” Andy.
Lots of manic yelling after his every sentence, “we’re all in this together”, and “the struggle continues” apparently.
FUNNY – Bernie Sanders Supporters Interviewed On Street (5:51)… enjoy, boys!
https://www.youtube.com/watch?v=GUe-2Wu3HUE
“So you like Bernie Sanders you just don’t know any of his plans.”
Rather than continue with Bernie Sanders on this sea level thread (an important topic not to be hijacked IMO), I think the ‘Obama’s climate hypocrisy” post is more appropriate.
Mike, Andy, can we take Bernie there?
‘More Climate Fraud From The United Nations And UCS’
Posted on June 8, 2016 by tonyheller
The United Nations says that the Statue of Liberty is threatened by sea level rise, and that the storm surge from Sandy was unprecedented.
[…see comprehensive debunking…..]
As far as I can tell, The UN and Union of Concerned Scientists never tell the truth about anything. They are total frauds, and as climate alarmists love to say – fraud is not protected by the first amendment.
http://realclimatescience.com/2016/06/more-climate-fraud-from-the-united-nations-and-ucs/
For the record (already somewhere upthread I think but here it is again):
New Zealand Parliament – 12. Climate Change—Sea Level Rise
Order Paper and questions – Questions for oral answer
[Sitting date: 12 April 2016. Volume:712;Page:10374. Text is subject to correction.]
12. EUGENIE SAGE (Green) to the Minister for Climate Change Issues: Does she agree with the statement made by GNS Senior Scientist Nancy Bertler that sea-level rise of 30cm in 30 years is “incredibly certain”, and the Parliamentary Commissioner for the Environment’s analysis that a 30cm rise would result in 1 in 100-year high water levels in Wellington happening every year?
Hon PAULA BENNETT (Minister for Climate Change Issues): In part, yes, but I would point out that even the Parliamentary Commissioner for the Environment and the scientist mentioned in the question disagree.
Continues>>>>>>>
http://www.parliament.nz/en-nz/pb/business/qoa/51HansQ_20160412_00000012/12-climate-change—sea-level-rise
# # #
I looked this up for “the statement made by GNS Senior Scientist Nancy Bertler” that sea-level rise of 30cm in 30 years is “incredibly certain”.
Can’t yet commit the name Nancy Bertler to memory. Maybe this will help.
This is my response to Thomas “gaga land” comment about me at HT
——-
Thomas,
The local NZ sea level rise trend via tide gauge records is not accelerating (Hannah et al, Otago, MfE, Tonkin and Taylor)
The claim that SLR has accelerated to 3.2 mm/year is spurious because you are comparing satellite data with tide gauge data. Neither individually demonstrates acceleration
Church and White have published two papers, to my knowledge, that claim a statistically significant acceleration on global sea levels. (C&W 2006 and C&W 2011)
C&W 2006 claims that
I have calculated the numbers based on their claims and can’t match the TAR values they suggest. Maybe someone can check for me.
Then, later C&W 2011 claim a statistically significant acceleration of 0.009 ± 0.003 mm year−2
http://link.springer.com/article/10.1007/s10712-011-9119-1
Note that this is less than the 2006 number.
These rates of acceleration give an addition SLR of less than 5cm over the secular trend of 17cm per century, according to my calculations, which I am happy to be corrected on, of course
23cm of SLR is a lot less than the one metre being quoted by our council
My comment hasn’t been published, this was Thomas original remark
Maybe Herr Thomas would like to inform the University of Otago, MfE, and Tonkin and Taylor that they are “deliberate misinformers” too.
That’s just the “global average illusion”.
Yes that is correct. However, C&W 2011 gets quoted a lot in local publications to “prove” that SLR is accelerating, and they often paste the 3.2mm figure into the same powerpoint.
I’m not sure if it is deliberate fraud or just stupidity
>”Might be a bit too inconvenient for Gareth, but lets give it a little time. If still not up……”
The comment is up:
andyS says: June 9, 2016 at 7:08 pm
http://hot-topic.co.nz/christchurchs-coastal-cock-up-review-panel-padded-with-climate-deniers/#comment-47749
No response from Thomas or anyone else yet (Macro’s notwithstanding or in respect to the more recent comment).
Andy, suggest you provide a sample of NZ TG data at HT:
TAURANGA (SALISBURY WHARF)
http://www.psmsl.org/data/obtaining/stations/1590.php
PORT TARANAKI
http://www.psmsl.org/data/obtaining/stations/996.php
PORT CHALMERS
http://www.psmsl.org/data/obtaining/stations/1643.php
WESTPORT HARBOUR
http://www.psmsl.org/data/obtaining/stations/1004.php
From PSMSL: Obtaining Tide Gauge Data
http://www.psmsl.org/data/obtaining/
Ask them what evidence is there of an “acceleration” in NZ TG data.
>”Ask them [HT] what evidence is there of an “acceleration” in NZ TG data.”
If they scoff at the short-term samples, remind them that the IPCC’s SLR baseline is the average of 1980 – 1999 nominally centred on 1990.
There are other TGs of course, including long running.
If they demand long running TGs, be happy to oblige with these Andy:
Variation of 50-Year Mean Sea Level Trends 690-002 Auckland II, New Zealand
http://tidesandcurrents.noaa.gov/sltrends/global_50yr.htm?stnid=690-002
Variation of 50-Year Mean Sea Level Trends 680-140 Sydney, Fort Denison 1 & 2, Australia
http://tidesandcurrents.noaa.gov/sltrends/global_50yr.htm?stnid=680-140
“Evidence doesn’t support rapid sea level rise”
NBR Friday 10th June, archived:
http://archive.is/6GXQZ
‘Taming the Greenland Melting Global Warming Hype’
By Patrick J. Michaels and Paul C. “Chip” Knappenberger June 10, 2016
[…]
Another big problem with all the new hype is that history shows the current goings-on in Greenland to be irrelevant, because humans just can’t make it warm enough up there to melt all that much ice. For example, in 2013, Dorthe Dahl-Jensen and her colleagues published a paper in Nature detailing the history of the ice in Northwest Greenland during the beginning of the last interglacial, which included a 6,000 year period in which her ice core data showed averaged a whopping 6⁰C warmer in summer than the 20th century average. Greenland only lost around 30% of its ice with a heat load of (6 X 6000) 36,000 degree-summers. The best humans could ever hope to do with greenhouse gases is—very liberally—about 5 degrees for 500 summers, or (5 X 500) 2,500 degree-summers. In other words, the best we can do is 500/6000 times 30%, or a 2.5% of the ice, resulting in a grand total of seven inches of sea level rise over 500 years. That’s pretty much the death of the Greenland disaster story, despite every lame press release and hyped “news” article on it.
While you won’t find this kind of analysis elsewhere, we’re happy to do it here at Cato.
http://www.cato.org/blog/taming-greenland-melting-global-warming-hype
I don’t expect any replies to my comment. Anyone who uses rational evidence based science is a “denier”
They have started quoting the Book of Genesis now. Oh dear