
Rising but not dangerously
Some say our arrogant, relentless use of coal, oil and gas dangerously heats the atmosphere, which in turn heats the ocean and raises sea levels.
The worry-warts were whinging about it in the New Zealand Parliament the other day, demanding we outlaw building near the beach because coastal houses will fall into the sea in 2050.
Some of us politely question the possibility of such a sharp rise in sea level because it denies the long-term trend. For 6000 years sea level rise (SLR) has been steady at about 1.8 mm per year (180 mm per century). Tide gauge readings since 1870 show no change from this.
When will this extraordinary rise begin
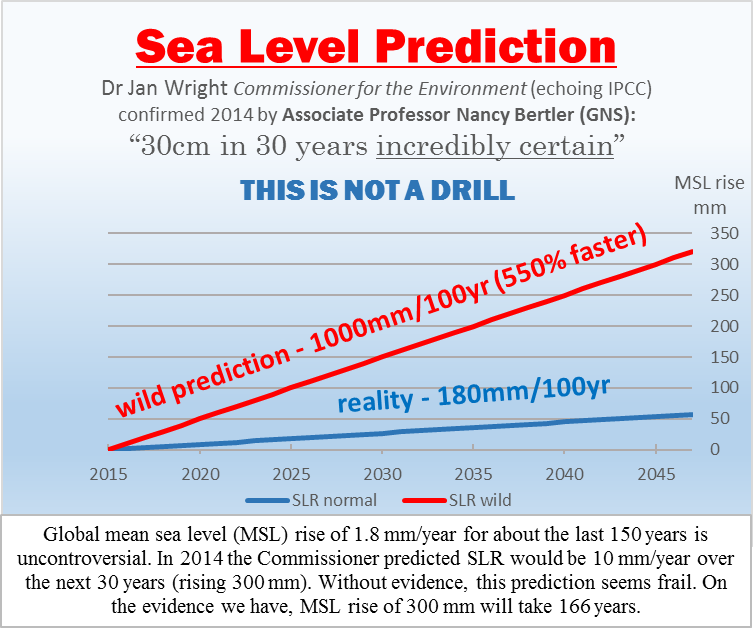
But the Commissioner for the Environment, Dr Jan Wright, echoing the IPCC’s AR5, predicted in her 2014 report Changing climate and rising seas: Understanding the science that for the next 30 years SLR will increase to 10 mm per year. In other words, it will suddenly surge to five and a half times the long-standing rate.
I examined that report and exposed some of its errors in Commissioner Wright’s wrong, Part 1 and Part 2. Since there’s no sign of acceleration, it raises the question of when the rise will begin. It’s easy to show how extraordinary the prediction is.
Here’s a graph that compares two simple facts: the underlying trend of sea level gauges over 150 years and the wild prediction given by the Commissioner, who apparently thinks, against all reason and without evidence, that at some unstated time the red line will magically supplant reality. But if nothing intervenes to change the rate of SLR, it will generally follow the blue line.
An important question about this ocean warming is how the tiny amount of air heated by our carbon dioxide emissions can radiate enough thermal energy to significantly heat the water. What is the physics of that? Our accumulated emissions make up only about 11% of 400 ppmv, or 44 parts per million by volume of the atmosphere, and it’s implausible that those few millionths could trouble the climate or threaten our survival.
The problem with accepting this ostensible heating from above is that no published paper has described a possible mechanism for such heat transfer. So science has no knowledge of its magnitude, yet the UN accuses Western civilisation of raising global sea level by this means.
The IPCC must try harder than this
Nobody has observed the process. Nobody can describe the amount of warming it causes. It’s reasonable to suppose that some warming of the water occurs, but significant heating is inconceivable. If you differ, please describe for us the mechanism of heating.
The IPCC expects to persuade us to close power stations, endure blackouts, cap oil wells, destroy airlines and scrap steel mills to prevent dangerously heating the sea. But they’ll have to try harder than this.
Climate activists assert loudly that our blast furnaces and SUVs have caused extra sea level rise, yet tide gauges show no sign of it. For the last 6000 years there’s been nothing but a steady natural rise, and a study of tide gauge records from 1880 shows no acceleration.
Rough comparison with hair dryer
So, we don’t understand how a little mildly warm air could significantly heat the ocean and we can’t detect the acceleration in SLR that was predicted years ago.
Here’s a rough comparison. A hair dryer is vastly hotter than our CO2 emissions. However, you can forget about getting anything resembling a warm bath by waving it over cold water. You’d do a lot better just to toss the plugged-in dryer into the cold bath and jump in after it. The trace gas we left in the atmosphere has no chance of warming the water.
The IPCC says global warming for the last hundred years was about 1 °C, with human influence about half of that, so any effect OF OUR EMISSIONS on sea level is related to only 0.5 °C, which must be ludicrously small. The IPCC claims that 44 ppmv of the atmosphere is radiating enough thermal energy downwards to dangerously heat the ocean, though it’s coming from CO2 molecules that have warmed only 0.5 °C. The argument is less than compelling.
IPCC vague on the air warming water
Of all the elements of climate science that deserve research, examining the possibility of human-generated CO2 molecules radiating significant thermal energy into the ocean must be at the top of the list. When you look into the boundary between air and water you learn that water exerts an overpowering influence on air temperature. Air warms or cools accordingly as it passes over water or ice. The influence is not the other way around.
The IPCC AR5 report (2013) doesn’t tell us how the air warms the water, referring to it only vaguely. Like these references from WG1AR5 Chp 8, p.712 (emphasis added).
Global Temperature change Potential (GTP) accounts for the climate sensitivity and the exchange of heat between the atmosphere and the ocean.
“The GTP values can be significantly affected by assumptions about the climate sensitivity and heat uptake by the ocean.” Does that refer to heat uptake or assumptions someone has made about heat uptake? So, in the absence of scientific knowledge of the air-to-water heating process, just when the general circulation models should have solid, reliable knowledge they come up empty.
Speculate, observe – hey, they’re different
Chapter 8 also says:
The formulation of the ocean response in the GTP has a substantial effect on the values; thus its characterization also represents a trade-off between simplicity and accuracy.
In other words, according to whether they speculate or make observations, they get different results — though you don’t have to be a scientist to work that out. Let us earnestly hope that the IPCC leans more to accuracy than simplicity.
By coincidence (or was it?) I noticed that, just the day after the recent climate questions in the House, Dr Wright addressed the Zealand Planning Institute’s annual conference: “We are certain that the sea is rising and will continue to do so for centuries,” she said. “If we stop emitting greenhouse gases today, it will continue to rise for years to come.”
The sea is rising, yes, and it may well rise for centuries, but that has nothing to do with emitting or not emitting greenhouse gases. For the sea was rising long before we began burning coal and oil. Though our emissions are at historical highs there’s no change in the rate of SLR, which means there’s no connection between our emissions and SLR.
Socialists have ripped out the heart of science
Dr Wright implies that the sea is rising because its temperature is rising. But it’s quite hard to be sure that its temperature is rising, because the ocean is vast and complex. There are 3500 Argo floats collecting data including temperature. But each one is alone in hundreds of cubic kilometres of ocean and takes measurements in that space for just a few hours every couple of weeks. We just don’t know what the trend is.
Examination of a dozen or so temperature graphs in the various ocean basins eliminates suggestions of a rising trend. All are highly variable, most seem flat, some trend down in recent years and some trend upwards.
It’s reasonable to conclude that the sea will indeed continue to rise for many years, whether or not we stop emitting any kind of gas — such as the hot air that emanates from the Ministry for the Environment.
As we untangle these green socialists’ unscientific, anti-industrial, hegemonic dissembling that man-made warming is dangerous we fear that they’ve ripped the heart out of science and threaten the glorious improvements of our last 300 years.
* Kiwis are internationally renowned for saying “yes, no”.
Views: 146
The key part of the parliamentary transcript starts here:
The obvious and most succinct answer to the question is “no”
So far this year, I have spent 2 days at the Independent Hearings Panel where the Environment Judge listened to our submissions, and I also got to cross examine council witnesses. I thought the judge, John Hassan, was actually very fair and respectful of people on both the public and the council side, and chastised both where appropriate.
The IHP have asked the Christchurch City Council to do further modeling based on 0m, 0.5m and 1.0m SLR projections over 100 years. The 0m is to give a baseline to factor out the SLR component of any modelling.
Based on this work, the IHP may support, reject, or make amendments to the proposed district plan.
Also, there is a new peer review of the Tonkin and Taylor report being commissioned. GHD are assembling the peer review panel based on recommendations. Yours truly is on the community engagement group for this, and our job is to solicit input from and communicate back to the local community
Good article RT. The quote of the month is “The argument is less than compelling.”
Andy – keep on their case mate, in your indefatigable, astute and polite manner.
Thanks, mate!
Excellent post, and that’s a handy little chart RT.
Very disappointing (to me) that a GNS employee, Nancy Bertler, has gone full stupid along with Jan Wright. Apart from their bizarro predictions, both neglect the IPCC’s baseline date, 1990.
The following paper should be required reading by these people BEFORE they make public utterances:
TIDE GAUGE LOCATION AND THE MEASUREMENT OF GLOBAL SEA LEVEL RISE
Michael Beenstock
Daniel Felsenstein
Eyal Frank
Yaniv Reingewertz
Abstract
The location of tide gauges is not random. If their locations are positively (negatively) correlated with SLR, estimates of global SLR will be biased upwards (downwards). We show that the location of tide gauges in 2000 is independent of SLR as measured by satellite altimetry. Therefore PSMSL tide gauges constitute a quasi-random sample and inferences of SLR based on them are unbiased, and there is no need for data reconstructions. By contrast, tide gauges dating back to the 19th century were located where sea levels happened to be rising. Data reconstructions based on these tide gauges are therefore likely to over-estimate sea level rise.
We therefore study individual tide gauge data on sea levels from the Permanent Service for Mean Sea Level (PSMSL) during 1807 – 2010 without recourse to data reconstruction. Although mean sea levels are rising by 1mm/year, sea level rise is local rather than global, and is concentrated in the Baltic and Adriatic seas, South East Asia and the Atlantic coast of the United States. In these locations, covering 35 percent of tide gauges, sea levels rose on average by 3.8mm/year. Sea levels were stable in locations covered by 61 percent of tide gauges, and sea levels fell in locations covered by 4 percent of tide gauges. In these locations sea levels fell on average by almost 6mm/year.
http://pluto.mscc.huji.ac.il/~msdfels/wpapers/Tide%20gauge%20location.pdf
# # #
>”Sea levels were stable in locations covered by 61 percent of tide gauges”
Where do we ever read or hear ANYTHING about “stable” sea levels at the majority of tide guages?
‘150 Years of Sea Level Rise in Germany’
April 24, 2016 by sunshinehours
Facts are stubborn things.
The Wismar, Germany, record is one of the longest and most complete records of sea level rise in the world. It not only shows a long-term trend of 1.4 mm/year, but it shows no change in that trend (no acceleration over the past 50 years) since carbon dioxide levels have gone from 325 to 400 parts per million.
https://sunshinehours.net/2016/04/24/150-years-of-sea-level-rise-in-germany/
Regardless of the CO2 and heating (even though NOAA recorded that 6 of the 7 hottest years on record have happened in the 21st century = https://www.ncdc.noaa.gov/sotc/global/2015/13/supplemental/page-3 and it seems pretty simple that if we put CO2 that had been sequestered for millions of years and water vapour along with it into the atmosphere we will get a change. It didn’t take a lot of CFC’s to wreck the ozone).
How about looking at it from a different angle and use some simple logic. Where is all that ice that is dissapearing from glaciers and land based ice sheets going to end up and why if the decline of glaciers and land based ice sheets is accelerating will sea level rise not accelerate with it?
https://nsidc.org/cryosphere/sotc/ice_sheets.html
http://wgms.ch/ggcb/
Yes we should use some simple logic. All the ice that is melting due to the computer models will make the seas rise 5 times as fast as they are now. We just need to wait a while, I’m sure next week we will see some evidence.
The CFCs didn’t wreck the ozone layer, by the way,
There was a small change in stratospheric ozone levels that was ascribed to CFC use, again mostly models and fairly noisy data with no clear signals. Sound familiar?
According to NASA, sea levels are rising at 3.42 mm a year
They kindly provide two graphs, one showing 3.42mm a year, and the tide gauges showing 1.5mm a year (*), on the same page
http://climate.nasa.gov/vital-signs/sea-level/
(*) Eyeballing 1870-1970
Funny how they don’t splice the two graphs together. Isn’t this a well known technique in climate science?
Ian,
In the sea, where else? Please provide a reference to quantify “all”.
Oh, you’re quite correct, and nobody would argue with this! If the “decline” accelerates, sea level rise will accelerate too. Goes without saying. But there’s been no acceleration in SLR for, oh, a century at least. So ice melt cannot be accelerating, wouldn’t you say? Still, give us a reference to this acceleration if you have one.
Ian,
>”Regardless of the CO2 and heating”
No Ian, not regardless, total regard.
CO2 (CH4, net anthro, etc) and heating is what the man-made climate change (MMCC/AGW) conjecture is ALL about – nothing else. Water vapour? This is the amplification requirement of the conjecture but how is that going models vs actual? Not so good.
The AGW conjecture is falsified by the IPCC’s own criteria and data from AR5. Everything else, GMST, SLR, glaciers, ice sheets, polar bears, penguins, is moot consequently.
Here’s how it goes:
IPCC climate change criteria: radiative forcing “measured at top of atmosphere” (IPCC AR4 FAQ 2.1, Box 1 – “What is radiative forcing?” – see below). Co = 280ppm, C = 400ppm.
# 0.6 W.m-2 TOA imbalance, trendless (Stephens et al 2012, Loeb et al 2012, IPCC AR5 Chap 2).
# 1.9 W.m-2 CO2 “forcing”, trending (dF = 5.35 ln(C/Co) and IPCC Table of Forcings, similar to net anthro).
Game over. CO2 “forcing” is more than treble the TOA imbalance, CO2 is an ineffective climate forcing.
# 0.6 imbalance TOA = 0.6 imbalance Sfc
Sfc imbalance is global average ocean heat accumulation (around 24 W.m-2 tropics, -11 W.m-2 Southern Ocean). Therefore, TOA imbalance is simply solar SW going straight into the oceanic heat sink and lagged in energy out at Sfc and LW out at TOA.
No need to invoke CO2 “forcing” and it is impossible to invoke anyway – it doesn’t fit between Sfc and TOA. IPCC AR5 Chapter 10 Detection and Attribution fails to address this.
Game over.
***************************************
FAQ 2.1, Box 1: What is Radiative Forcing?
[A] – “The word radiative arises because these factors change the balance between incoming solar radiation and outgoing infrared radiation within the Earth’s atmosphere. This radiative balance [‘measured at the top of the atmosphere’] controls the Earth’s surface temperature”
And,
[B] – “When radiative forcing [‘measured at the top of the atmosphere’] from a factor or group of factors is evaluated as positive, the energy of the Earth-atmosphere system will ultimately increase, leading to a warming of the system. In contrast, for a negative radiative forcing, the energy will ultimately decrease, leading to a cooling of the system”
https://www.ipcc.ch/publications_and_data/ar4/wg1/en/faq-2-1.html
Stephens et al (2012) Figure 1
http://www.nature.com/ngeo/journal/v5/n10/images/ngeo1580-f1.jpg
Loeb et al (2012) Figure 1
http://www.skepticalscience.com/pics/Loeb2012-TOAfluxvsOHC.jpg
# # #
Climate scientists are NOT qualified applied heat specialists. They know nothing of radiative heating effects on surface materials, their conjecture violates the Claudius statement of the Second Law of Thermodynamics and their models violate the Kelvin-Planck statement of the same law.
Similarly, climate scientists neglect the physics of the atmosphere-ocean interface (AO). The IPCC justs speculates on it (“air-sea fluxes” – no citations whatsoever), except the flux (CO2, IR-C) is NOT a heating agent on surface materials so it is pointless considering it. They went looking for the flux in Chapter 2 but couldn’t find it among far greater real heating agents e.g. surface solar radiation (SSR, IR-A/B) of 10 W.m-2/decade for a couple of decades regionally.
The CO2 component of downwelling long-wave infrared radiation (DLR, IR-C) was 6 W.m-2 in the 1976 standard atmosphere. It is the CHANGE in that flux that climate science blames for surface heating but it is NOT a heating agent. The CO2 change is only in the order of 0.3 W.m-2/decade currently. And DLR only penetrates the ocean surface 100 microns max on a good day. That’s about the thickness of a human hair. The NET IR-C radiation flux, on global average, is a COOLING flux – outgoing long-wave radiation (OLR – about 50 W.m-2).
And in the troposphere CO2 is a passive heat transfer medium. CO2 is a COOLANT by definition – refrigerant code R744. In 1963 and updated 1976, the US Air Force Labs modeled the atmospheric temperature from surface to TOA for the space race. CO2 was neglected because it is an insignificant trace gas and they made no recourse to the “greenhouse effect” whatsoever. It is a redundant concept.
[BTW Ian, how much of the heat from the current El Nino heat spike do you think the “heat trapping greenhouse gasses” will “trap” – zero according to the Kelvin-Planck statement of the Second Law of Thermodynamics or almost all as per climate scientists Schmidt, Rahmstorf, Sherwood, Foster, Mann, in particular?]
This just goes on and on Ian but suffice to say that CO2 not being the heating agent climate science assumes it to be is the critical issue.
Ian – >”Where is all that ice that is dissapearing from glaciers and land based ice sheets going to end up”
Where is all the ice from NZ’s glaciated valleys or the Laurentide Ice Sheet? Why did it disappear? Where did it go?
You might think about this graph for a while Ian:
Post-Glacial Sea Level Rise
https://upload.wikimedia.org/wikipedia/commons/1/1d/Post-Glacial_Sea_Level.png
>”(even though NOAA recorded that 6 of the 7 hottest years on record have happened in the 21st century)”
So what? This is only the natural cyclic component of global temperature in response to major solar change. The CO2-forced climate models are running MUCH warmer than observations in the 21st century. The IPCC tacitly admits in AR5 Chapter 9 that 111 of 114 CMIP5 simulation submissions are junk. They even offer 4 reasons why their models are wrong.
Point is, at present CO2 forcing is excessive (models “too sensitive” to CO2 – IPCC) and the acid test is on the CO2 conjecture from now until about 2020. If there’s no radical ENSO-neutral warming (see UKMO 5-yr “decadal” forecast) then man-made climate change is a dead issue.
And if after 2020 the solar conjecture kicks in i.e. ENSO-neutral cooling, CO2 forcing will be proved to be superfluous – not just excessive.
Ian
>”(even though NOAA recorded that 6 of the 7 hottest years on record have happened in the 21st century)”
According to NASA GISS (GISTEMP), the 2015 record was Northern Hemisphere only. The Southern Hemisphere Extratropics (think Auckland, Sydney, Johannesburg, Buenos Aires) saw nothing of it:
Annual Mean Temperature Change for Three Latitude Bands [GISTEMP]
http://data.giss.nasa.gov/gistemp/graphs_v3/Fig.B.gif
NZ in 2015 was 27th warmest according to NIWA, AU 5th according to BOM.
So much for “global” warming.
Wow really, c’mon guys pull your heads out of the sand.
https://www.ncdc.noaa.gov/sotc/global/201313
The anomalous warmth was also present during austral winter in New Zealand, which experienced its fourth warmest July and record warmest August. These warm months contributed to the country’s warmest winter on record.
And the link below is the past 100 years from Niwa so you don’t just have to choose 2015 to bias your arguement.
https://www.niwa.co.nz/climate/information-and-resources/nz-temperature-record
Accelerating ice loss according to NASA.
http://climate.nasa.gov/news/2328/
Several studies have shown that different remote sensing methods for studying ice sheet mass balance agree well. GRACE’s record, spanning over a decade, shows that the ice loss is accelerating in Greenland and West Antarctica. Greenland has shed, on average, 303 gigatons of ice every year since 2004, while Antarctica has lost, on average, 118 gigatons of ice per year, with most of the loss coming from West Antarctica. Greenland’s ice loss has accelerated by 31 gigatons of ice per year every year since 2004, while West Antarctica has experienced an ice mass loss acceleration of 28 gigatons per year.
Ozone and CFC reaction was confirmed.
http://ozonewatch.gsfc.nasa.gov/facts/history.html
I agree the Sun can change our climate and has in the past and will in the future to the point where the earth is burnt to a crisp in a few billion years but there has been no major solar change recently. The change in the Sun’s yearly average total irradiance during it’s 11-year cycle is on the order of 0.1 percent according to NASA. These varations have been discounted as a reason for the amount of temperature rise observed. IPCC report said it may acount for half the warming.
Human activities have accelerated the change.
Accept it, buy an electric car and move inland.
Ian,
Buy an electric car
Yes great idea. That will stop the catastrophic sea level rise of 1.7mm a year, that isn’t accelerating despite your claims that human activity has accelerated the change,
Maybe when you have some actual evidence that human activity has even influenced sea levels you can come back with something more interesting than a used car sales pitch
“come back with something more interesting than a used car sales pitch”
Andy, that’s cruel; hilariously cruel.
Sorry I am running on a short fuse. I need to calm down. Sorry Ian, it’s not personal
We’ve got our first meeting with GHD with regard to the Tonkin and Taylor peer review this arvo..
Breathe……
You’re doing good work, Andy, and it’s not all for the sake of self-interest.
and it’s not all for the sake of self-interest
No of course I need to do my bit for Big Oil and the Koch Brothers too. /sarc
Ian
1) You neglect to address the issue that the man-made climate change conjecture (MMCC) is falsified by the IPCC’s own data as laid out upthread (plus the other issues raised in same comment). FAIL
2) You link to a NOAA 2013 summary? Huh? Why back in 2013, it is now 2016 for which there is monthly data Ian (see upthread). FAIL
3) You link to the NZ temperature record but that does NOT include 2013 or any data past 2009. FAIL
Here’s the NIWA 7SS data that the NIWA page has NOT updated:
2010 13.10
2011 12.80
2012 12.50
2013 13.40
2014 12.80
2015 12.70
2013 was exceptional, the rest not so much. NIWA states that 2015 was “27th warmest since 1909″ in an El Nino yeqr. Not very alarming is it?
And the NZ temperature data (NIWA or BEST) is NOT conforming to the CO2-forced predictions from the 1990 baseline as per IPCC that can be found on NIWA’s prediction page. FAIL
4) Whatever happens to ice (in your VERY short cherry-picked term – since 2004? get real on 30 yr on 30 yr climate regimes Ian) is moot if the primary critical hypothesis of MMCC is falsified by the primary critical criteria. FAIL
5) >”The change in the Sun’s yearly average total irradiance during it’s 11-year cycle is on the order of 0.1 percent”
Totally irrelevant. FAIL
The relevant solar change TSI metric is on a bicentennial, millennial and multi-millennial timescale. Read the Usoskin paper on solar change over the Holocene (last 11,000 yrs). The Modern Grand Maximum was the highest solar activity since the start of that period. The intermediate fluctuations are highly uncertain but for context, Shapiro et al found a 6 W.m2 change from Maunder Minimum to Modern Grand Maximum. The IPCC dismisses this out of hand. I have IPCC AR5 solar citation co-author and Detection and Attribution contributing author Mike Lockwood on email record saying he “does not understand Shapiro et al’s methodology. 6 W.m-2 easily accounts for ocean warming in the intervening time (which is what drives atmospheric waring i.e. the secular trend (ST) in GMST (basically you’re just looking at NH skew). Overlaid on the ST is a multi-decadal oceanic oscillation (natural variation – in this case MDV). The IPCC admits in AR5 that they have neglected this naturally varying MDV.
IPCC AR5 does NOT have a solar chapter, just one brief contra-solar section featuring one bogus modeling paper (Jones, Lockwood, and Stott – all Detection and Attribution authors) that was already wrong when published as evidenced by the divergence of their 21st century simulation from observations even at 2010.
The alternative NIPCC Climate Change Reconsidered II on the other hand, DOES have a solar chapter – Chapter 3: Solar Forcing of Climate, with a list of citations as long as your arm.
# # #
6 FAILS. In short, your response is so deficient it’s laughable Ian.
Ian, a challenge for you:
How much of the heat released by the 2015/16 El Nino spike will be “trapped” in the troposphere by “heat trapping greenhouse gasses”:
A) Most of it according to climate scientists Schmidt, Rahmstorf, Sherwood, Foster, Mann, in particular, who have claimed the bulk of the El Nino spike for AGW/MMCC (yes we have that on record) ?, or
B) None of it according to the Kelvin-Planck statement of the Second Law of Thermodynamics (in respect to heat sinks – space in this case).
This is an acid test Ian, be careful how you vote. The results either way will be in by the end of this year.
Ian, re the challenge to you above.
It’s not just the climate scientists mentioned, it’s also the UKMO. See their annual 5-yr “decadal” forecast here:
UKMO: Decadal forecast
http://www.metoffice.gov.uk/research/climate/seasonal-to-decadal/long-range/decadal-fc
Their blue prediction trajectory is off the TOP of the 2015 El Nino spike i.e. they predict that temperature will remain elevated at El Nino levels and ABOVE.
Given the UKMO’s record of annual forecast failure, do you think this will happen Ian?
Again, careful how you answer. A good indication of ENSO-neutral data will be in by the end of the year.
LOL, Used electric car salesperson, thats great.
Well then since I am doing the sales pitch do you know that they are cheaper to run than a petrol or diesel vehicle even at 1.00 per L for petrol? No… never mind then.
As for Fail’s the only FAIL around here is your ability to think outside your narrow view Richard C.
You linked to a picture of the post glacial period for sea level. In it are periods of accelerated sea level rise. How about looking at the other post glacial periods further back when sea level was higher than it is today?
There is still plenty of ice to melt.
Your calculations on ice sheets in the new thread are erroneous by the way.
It is a mass ballance, that includes precipitation and loss.
Do you understand what a mass balance is?
I am not a Climate Scientist and neither are any of you as you are not using scientific method.
What measurements or observations have you personally been involved with?
Thats why we should leave it to real Scientists.
http://climate.nasa.gov/scientific-consensus/
http://climate.nasa.gov/vital-signs/land-ice/
Richard T
You can use the handy search function in your browser to find a text quote.
100 hyperlinks might be a slight exageration don’t you think. There are two in this one for your reference.
Adios chaps, I’m off to buy an electric car and save some money.
I’m glad that Ian is off to buy an electric car to save money. I’m just wondering why the rest of the country isn’t following suit.
Is it possible that the rest of the country can see the “bigger picture” that electric cars are expensive to buy and difficult to quickly recharge, which is the reason most people don’t have them.
This also possibly explains the “siloed” thinking where we see a small benefit or signal in one area without looking around us.
I can’t help thinking that a lot of academic research is like this too. Researchers into West Antarctic ice melt conditions may be alarmed and may wish us to be alarmed too, but to date this alarm hasn’t presented itself in local sea level data
Having said that, if anyone wants to shout me a test drive in a Tesla, I’m on for it
Ian will have to pay a premium in order to “save” but what’s depreciation cost for EVs? If motorists had to write out an annual cheque for depreciation they might have a better grasp of what their vehicle is costing them (unless they are wealthy enough not to care).
And he wont be using air conditioning or heating much if he doesn’t want to drain the battery. Air con’s a hog. Try turning your air con on and off while running a petrol engine and listen to the engine note and watch the tacho. There’s an instant load that needs a lot of power and the smaller the motor the greater the effect. In an EV that depletes the battery quick-time.
But yes, I\d like to punt a Tesla too.
Re challenge to Ian upthread, which he appears to have sidestepped (as did Hot Topic), viz:
Joe Bastardi, Weatherbell, Tweets (see NCEP graph):
Not looking good for the climate scientists – all that AGW/MMCC attributed “warming” is now “cooling”.
I’ve shared the slide decks that someone gave me from the recent conference on sea level rise in Auckland
https://drive.google.com/folderview?id=0B1rLpjlKgqyiLWZxQTNSeDlRNk0&usp=sharing
There are 11 slide decks
Let me know if you can’t access the folder.
>”Let me know if you can’t access the folder.”
I can access the folder and slides OK but it’s clunky viewing over the internet on my connection.
Can we have Download Permission Andy?
I got as far as Rob Bell’s Temp vs CO2 graph on slide 2 including 2015 El Nino spike and called it quits for a while.
Thinking – “Right, I think I know where this is going”.
>”Can we have Download Permission [please] Andy?”
I’ve uploaded a zip file of the slides to here
https://www.dropbox.com/s/01hcny82sbsrtwf/Presentations_from_Sea_Level_Rise_Conference-2016-05-02.zip?dl=0
The draft of the Tonkin and Taylor peer review is up at the following link under “what’s new”
http://www.christchurchsealevelrise.co.nz/
Disappointing at first look Andy but one redeeming feature – 10 year review “at least”. I would have thought “at most” though. North Carolina adopted 5 year reviews.
Still no default scenario using historical rates of rise that I can see (exceptions [60] and [77] below). That would be the first priority for “good science” surely? All they have done is used RCP8.5 “adjusted” for historical rate i.e. adding RCP8.5 prediction to historical rate. But they do recommend recourse to historical tide guages for maximum storm surges in [60] and [77]. That’s good.
Executive Summary
[5] We also note that the IPCC RCP8.5 sea level rise projections for 2065 do not vary greatly (0.27 to 0.47 m). There is greater variability in the 2115 projections (0.62 to 1.27 m). Future changes in sea level rise projections for 2115 may be incorporated into an at least 10 year review process of the Coastal Hazard Assessment.
Great. But “at most” 10 year review surely? And a review of IPCC changes but why not a review of changes, if any, to the historical rate of rise? You have to insist on this Andy.
[25] The Report’s findings do not close off subsequent use of adaptive planning responses for CCC. The findings will be subject, when reassessed as a result of the panel’s responses, to two subsequent stages of stakeholder and community consultation before conclusions can be reached. No conclusive mapping should take place until these consultation stages are complete.
This has to be one of the best recommendations from the community’s perspective I think i.e. it’s not all cut and dried.
Good science?
Assessment and critique of methodology and data used
[48] The SLR values adopted in Table 4.10 for 2065 and 2115 are based on the middle and 5-95% range of projections from process based models from IPCC AR5 in Figure 2.3 (this band of values is considered ‘likely’ by the IPCC panel of scientists). A minor error appears to have been made in listing a value of 1 m for 2115 in the Table when the Figure indicates 0.94 m.
Good grief. Where’s the “critique” except for “minor error”. Where’s the historical default scenario?
Open coast beach Coastal Inundation Hazard Zone (CIHZ)
[60] ………………Extreme water levels within the harbour embayments are complex with varying contributions at varying timescales including tides, storm surges, waves, winds, seasonal effects, El Niño Southern Oscillation/ Inter-decadal Pacific Oscillation, long period edge waves and resonance, (Goring & Henry, 1998; Borrero et al, 2013; Goring 2014, 2015; Borrero & Goring, 2015). It is recommended that an updated thorough analysis for extreme water levels of all water level monitoring stations in the Canterbury area be undertaken prior to the first reassessment/review…………………
Finally! A recommendation to assess the actual recorded data. BEFORE a reassessment. This good.
[63] SLR values used in Table 4.2 are 0.4 m for 2065 and 1 m for 2115 – the stated basis being recommendations from Bell (2013) and Tonkin & Taylor (2013a) – the values are reasonable for inclusion of regional/local effects in consideration of the IPCC AR5 values shown in Figure 2.3.
Comment as for [48] above.
[66] Overall, the various approaches used for determination of the CIHZ lines for the open coast have been consistent with the ‘building block’ approach of Ramsay et al (2012). They are likely to have over-predicted the extent of inundation for both 2065 and increasingly so for 2115.
A likely over-prediction and increasingly so. That’s a biggy.
Harbour Coast Science
Harbour Coast CEHZ
[70] The simple equation 8 is used to estimate shoreline adjustment with SLR – the slope to be used being determined from analysis of aerial photos or LIDAR between the HAT contour and the beach toe (noticeable break of slope). The adopted SLR values used in Tables 4.18 and 4.19 are the mean 50% RCP8.5 values from Table 4.10 adjusted for the historic rate of SLR.
Comment as per [48] and [63]. Also, I don’t see Tables 4.18 and 4.19 anywhere in this report. I’m assuming they are referring to the T&T report. Might have been good to include those tables in an appendix to this report.
[74] The mapped CEHZ lines for all harbour sites including the Avon-Heathcote Estuary and Brooklands Lagoon are misleading and should not be considered as indicative of likely erosion hazard. It is recommended that they be re-assessed with more attention to detail and on-ground inspections. The ‘high tide translation’ method values must be discarded and only the ‘equilibrium profile’ values considered………………
Ouch.
Harbour Coast CIHZ
[77] The storm tide values for 1% and 2% AEP were appropriately based on water level gauge analyses for Lyttelton and Sumner Head by Goring et al (2009, 2011). As noted in the discussion on CIHZ for the open coasts, these two water level monitoring sites appropriately have sufficient record lengths to allow reasonable analysis for predicting 2% and 1% extreme water levels for 2065 and 2115 respectively – the prediction of the 1% 2115 extreme storm tide levels being less reliable than those for 2% 2065 value. Extreme water levels within the harbour embayments are complex with varying contributions at varying timescales. It is noted that there are other monitoring stations within the harbour and surrounding areas (Kaikoura, Timaru, Sumner, Port Lyttelton, Akaroa, Canterbury Bight) that may provide useful extreme water level information. It is recommended that an updated thorough analysis for extreme water levels of all water level monitoring stations in the Canterbury area be undertaken prior to the first reassessment/review.
OK, fine. Good science. But same as for [60]. They must consider a default historical-only prediction scenario and regular review of it. Again, you must insist on this Andy.
[79] As for the open coast, SLR values used in Tables 4.16 and 4.15 are 0.4 m for 2065 and 1 m for 2115 – the stated basis being recommendations from Bell (2013) and Tonkin & Taylor (2013) – the values are reasonable for inclusion of regional/ local effects in consideration of the IPCC AR5 global values shown in Figure 2.3
Comment as per [48], [63] and [70]. This is getting monotonous. It all comes down to one scenario assumption.
This is NOT GOOD SCIENCE. What an inept review this is.
Again, again. You have to insist on the inclusion of a default historical-only prediction scenario and regular review of it Andy.
[80] …………………As for the CIHZ open coast, it is recommended that prior to the first reassessment/review and in conjunction with the recommended update of extreme water levels from monitoring stations the likelihood of concurrence of extreme winds and waves with coincidence of peak wind and wave setup with extreme storm tide be investigated.
Good. Comment as for [60] and [77].
# # #
That’s enough for now. I’ll have a look at the rest for anything worthwhile, if there is any, in a following comment.
Areas of scientific uncertainty
[98] Ramsay et al (2012) recommends that a range of sea-level rise scenarios be assessed for the future timeframe(s) under consideration and the sensitivity of the resulting coastal change/ inundation ascertained (Box 3 – Key checklist for coastal hazard assessments). Such scenarios can incorporate possible regional variations from global sea level projections. Based on discussions with CCC, the hazard assessment has been restricted to considerations of climate change SLR projections based on RCP 8.5. With more time it would be useful to have the assessments for CEHZ and CIHZ also undertaken for other RCPs. It is recommended this be done in the first reassessment/review when the likely RCP pathways may be clearer.
[99] It is noted that few scientists believe the RCP2.6 pathway is now possible, so this emission scenario could reasonably be excluded from any future scenario sensitivity assessments.
[100] It is also noted that RCP8.5 is a very high scenario, also referred to as a ‘business as usual’ scenario, with atmospheric concentrations based on the continuation of current emission levels. It is commonly adopted as an upper level scenario in hazard assessments.
[101] Although it is likely that sea level rise will affect the processes that result in coastal inundation, Ramsay et al (2012) state that a pragmatic approach is to add future sea level rise to current inundation levels to estimate the future hazard as has been done in the Report. The result is, however, noted as being conservative – that is, an over-estimate.
# # #
Has it crossed their minds that the very first consideration, before any IPCC-based “scenario”, is what is actually occurring in the real world right right up to the present and as time goes on?
Distributions and the probabilistic approach
[106] An issue has been raised by the community in the form a statement that ‘the best international guidance is that 1 m sea level rise in 100 years is very unlikely’.
Their dismissal of this in [107], [108], [109] and [110] and their reasoning is astounding. They set up a strawman and then say in [110] that the strawman “has no validity”.
Are the Report’s findings relevant in terms of new research?
[114] Therefore, while there is no specific new research that necessitates a modification of the Report, it is recommended that a review of published research be incorporated into each reassessment/review of coastal hazards.
Research, but not simply observational data?
They said in [77] there are “monitoring stations within the harbour and surrounding areas (Kaikoura, Timaru, Sumner, Port Lyttelton, Akaroa, Canterbury Bight)”.
Hello.
RC,
It may not be as bad as you think, for with review periods, higher frequency means “more”. So “at most” expresses the intention to review less frequently rather than more frequently. If you want more frequent reviews you should suggest 10 years “at least” to mark 10 years as the maximum period. That’s the way I see it. Others may interpret it differently.
Their dismissal of this in [107], [108], [109] and [110] and their reasoning is astounding. They set up a strawman and then say in [110] that the strawman “has no validity”.
I was most disappointed in the lack of robust statistical reasoning in the report.
Policy 3 The Precautionary approach
[150] Policy 3 Precautionary approach is required to apply towards ‘proposed activities’ whose effects on the coastal environment are uncertain, unknown or little understood, and to apply to the ‘use and management of those activities’ in the coastal environment. But the Report has applied it to determining sea level rise projections in the following manner:
[161] We concluded the reference to the Policy 3 precautionary approach should be removed from the Report for it does not add anything and does not apply to the relevant issues to which it applies.
# # #
Ok, even after removal of “precautionary approach” T&T stil says “this assessment has adopted sea level rise values projected for the RCP8.5 scenario – emissions continue to rise in the 21st century”.
In other words, they have “adopted” just ONE scenario based on an as yet unproven theory (actually falsified by the IPCC’s observations applied to their primary criteria) and exclude consideration of actual SLR rates.
NOT GOOD SCIENCE.
Policy 24(1)(h) The likely effects of climate change on the district on all of the above (a) to (h) of the policy
[184] The definition of climate change in s 2 RMA identifies that the concept means ‘a change of climate that is attributed directly to human activity that alters the composition of the global atmosphere and that is in addition to natural climate variability over a considerable time period’.52
[185] The constant in both definitions appears to be:
# a statistical variation in either the mean state of the climate or its variability …
# a change of climate that allows for the changes in the composition of the global atmosphere due to human activities and that is in addition to natural climate variability …
[186] Thus what NZCPS Policy 24(1) requires is an examination of the mean state of the current climate and its variable adjustments, a statistical characterisation of that data, or an assessment of potential climate change in addition to natural climate variability in order to provide (with medium confidence) the likely effects on the Christchurch district.
[187] IPCC AR5 Table 25-1 provides a chart of climate variables including mean air and sea surface temperatures, precipitation (rainfall), fine weather, drought, severe storms, snow and ice. The categories include projected change, its direction, examples of projected magnitude of change relative to, for example, 1990 with additional comments.53
[188] An assessment incorporating those factors would assist the community in identifying statistical shifts in the statistics.
# # #
Wow, [188] is HUGE.
In effect, what they are asking for is statistical validation of anthropogenic attribution. That attribution is to a signal “that is in addition to natural climate variability”.
Even the IPCC has not been able to do that.
This is what we’re delving into with signal analysis in the ‘Gavin Schmidt confirms model excursions’. Examples there of different analysis approaches, Wyatt & Curry (2014) and subsequently Kravtsov et al (2014) versus Mann et al (2014). That’s here and above and below:
Richard C (NZ) on July 24, 2016 at 11:29 pm said:
https://www.climateconversation.org.nz/2016/07/gavin-schmidt-confirms-model-excursions/comment-page-1/#comment-1501514
Once signal analysis is applied it becomes obvious that “natural climate variability” is overwhelming. Turner et al (2015) has discovered this in respect to the West Antarctic Peninsular. That’s here and above and below:
Richard Treadgold on July 25, 2016 at 1:14 pm said:
https://www.climateconversation.org.nz/2016/07/renwick-naish-invoke-malignant-consensus-cite-scandalous-papers/comment-page-1/#comment-1501615
We could restate [188] in terms of SLR and [184]:
“# a statistical variation in either the mean state of the [SLR rate] or its variability”
“Variability” is all the variability in long-term records of sea level measurement. A “statistical variation” that is “in addition to natural [SLR]” was not found in this paper (from upthread):
Is anthropogenic sea level fingerprint already detectable in the Pacific Ocean? [Answer: No]
H Palanisamy, B Meyssignac ,A Cazenave and T Delcroix (2015)
http://horizon.documentation.ird.fr/exl-doc/pleins_textes/divers15-09/010065224.pdf
[187] does not include SLR in the “chart of climate variables” i.e. only “air and sea surface temperatures, precipitation (rainfall), fine weather, drought, severe storms, snow and ice”.
If SLR is included in [188] anthro attribution becomes highly problematic (ask Palanisamy et al).
[188] is THE BEST RECOMMENDATION in the review.
Andy, if nothing else, you have to insist that either:
A) SLR is included in the [188] statistical analysis recommendation; or,
B) SLR is THE ONLY variable statistically analysed in [188].
RT
>”…..with review periods, higher frequency means “more”. So “at most” expresses the intention to review less frequently rather than more frequently. If you want more frequent reviews you should suggest 10 years “at least” to mark 10 years as the maximum period. That’s the way I see it. Others may interpret it differently.”
Yes, that does make sense but I was wondering it that was actually what they meant. The other interpretation is that the first review would be in “at least” ten years time i.e. maybe 10, 12, 15 etc.
Seems ambiguous to me although yes, we would have to favour your interpretation RT. Needs clarification I think.
Andy
>”I was most disappointed in the lack of robust statistical reasoning in the report.”
I haven’t checked the scope on this so I’m not sure to what extent they would have been expected to go statistically.
However, nothing lost because in [188] they call for “An assessment incorporating those [climate] factors would assist the community in identifying statistical shifts in the statistics.”
This is a huge win, especially if the historical rates of SLR are either included in the “factors” assessed or addressed specifically in respect to [188] i.e. neglect all the other factors, just assess SLR statistically.
Basically, the statistical analysis would have to provide validity to the use of IPCC RCP scenarios i.e. identify a human-caused signal that is “in addition to natural climate [or SLR] variability”.
I can only repeat my previous comment – “[188] is THE BEST RECOMMENDATION in the review”.
Yes “[188] is THE BEST RECOMMENDATION in the review”. thanks and noted
Andy >”Yes “[188] is…..”
It’s really that sequence of [184], [185], [186], [187], and [188].
[188] doesn’t take on much significance without knowing the context of the preceding [184 – 187] sequence. I don’t think I’ve seen that statistical criteria and those definitions combined in such a way anywhere else. And then statistical analysis requested to be done and applied to the defined criteria. I don’t recall the IPCC defining, requiring, or citing such a statistical exercise anywhere in Chapter 10 Detection and Attribution. Surely they do – I’ll look, but meantime see below.
A quick web search turns up this:
‘Statistical analysis rules out natural-warming hypothesis with more than 99 percent certainty’ [Shaun Lovejoy]
http://phys.org/news/2014-04-statistical-analysis-natural-warming-hypothesis-percent.html
But Lovejoy’s approach is not what the review is calling for (I think Lovejoy was debunked by McIntyre anyway, maybe wrong).
Also,
Google search – “I{CC statistical isolation of human caused climate change from natural variation”
http://scholar.google.co.nz/scholar?start=10&q=statistical+isolation+of+human+caused+climate+change+from+natural+variation&hl=en&as_sdt=0,5&as_vis=1
Turns up this,
How natural and anthropogenic influences alter global and regional surface temperatures: 1889 to 2006
JL Lean, DH Rind – Geophysical Research Letters, 2008 – Wiley Online Library
http://onlinelibrary.wiley.com/doi/10.1029/2008GL034864/full
Full paper. OK, this is closer but again, not what the review is calling for. That Lean & Rind exercise is all about linear trends which is way too simplistic (think signal analysis for a sophisticated approach). They can only account for “76%” of variance anyway:
5. Summary
[15] Empirical models that combine natural and anthropogenic influences (at appropriate lags) capture 76% of the variance in the CRU monthly global surface temperature record, suggesting that much of the variability arises from processes that can be identified and their impact on the global surface temperature quantified by direct linear association with the observations.
Not good enough. Their linear approach is unsophisticated, Big problems with their natural factors (e.g. solar) And not in respect to SLR.
Such a statistical analysis as the review is calling for must include SLR to be of any value. And if after SLR is included, why bother with anything else?
Should be,
Google search – “ipcc statistical isolation of human caused climate change from natural variation”
http://scholar.google.co.nz/scholar?q=ipcc+statistical+isolation+of+human+caused+climate+change+from+natural+variation&btnG=&hl=en&as_sdt=0%2C5&as_vis=1
The use of the expressions “at least” and “at most” to qualify periods of time is rooted in ambiguity because of the two intrinsic qualities of a period: length and frequency, unless the quality being referred to is specified. Resolve the ambiguity simply by specifying the quality. For example, “at least once every five years (this is the minimum frequency—I prefer more than once every five years);” or “at least five years between reviews (this is the minimum length—I prefer more than five years between reviews).”
I have to reiterate (sorry).
An analysis such is being called for by the review in recommendation [188] has already been carried out specifically in respect to satellite sea level data for the Pacific Ocean (i.e. not NZ tide guage data specifically). That was the paper I referenced above:
Is anthropogenic sea level fingerprint already detectable in the Pacific Ocean?
H Palanisamy, B Meyssignac , A Cazenave and T Delcroix (2015)
http://horizon.documentation.ird.fr/exl-doc/pleins_textes/divers15-09/010065224.pdf
No anthropogenic sea level fingerprint was detected; no statistical signal “in addition to natural climate variability” as per [185].
This is the state-of-play in the Pacific from satellite data. The review panel needs to know about this. Palanisamy et al (2016) is not referenced in their review Bibliography.
>”I don’t recall the IPCC defining, requiring, or citing such a statistical exercise anywhere in Chapter 10 Detection and Attribution. Surely they do – I’ll look”
OK I’ve looked. Relevant sections are these, my comment thus [2) Yada yada…..]:
10.2.1 The Context of Detection and Attribution……………… 872
10.2.2 Time Series Methods, Causality and Separating Signal from Noise…………….. 874
10.2.1 The Context of Detection and Attribution
The definition of detection and attribution used here follows the terminology in the IPCC guidance paper (Hegerl et al., 2010).
[1) This is not a statistical signal “in addition to natural climate variability” as per [185]. See below after “# # #” for more on this and a comparison of criteria]
[2) Attribution goes on in further paragraphs but this is enough to see where they are going. Their statistical analysis is in respect to “a process-based model”. Totally unnecessary for statistical analysis of SLR as demonstrated by Palanisamy et al (2016). And not what the review is calling for.]
[3) This is rubbish. There is plenty of SLR data to determine “natural [SLR] variability” as per [185]. And Palanisamy et al (2016) had no such model in their analysis.]
10.2.2 Time Series Methods, Causality and Separating Signal from Noise
[4} OK, so not “impossible” without models after all, or minimal use of. Again, Palanisamy et al (2016) used no such model in their analysis.].
[5) So it’s only “other studies” that use models to any extended degree]
[6) As for their first “impossible” assertion – this is rubbish and provably so. Particularly in regard to SLR]
# # #
That’s about it from 10.2.1 and 10.2.2. Nowhere do they actually define their statistical criteria. And the criteria they do define in 10.2.1 ‘Detection’ is somewhat different to what the review’s recommendation [188] lays out:
[IPCC 10.2.1] – “An identified change is detected in observations if its likelihood of occurrence by chance due to internal variability alone is determined to be small’”.
[Review 184] – “‘a change of climate that is attributed directly to human activity that alters the composition of the global atmosphere and that is in addition to natural climate variability over a considerable time period”.
This is a radical difference in criteria.
The Palanisamy et al (2016) approach is directly applicable to [188]. Better still it is specifically in respect to SLR in the Pacific. And Palanisamy et al (2016) contradicts the IPCC’s 10.2.2 assertion that “Attribution is impossible without a model”.
>[Review 184] – “‘a change of climate that is attributed directly to human activity that alters the composition of the global atmosphere and that is in addition to natural climate variability over a considerable time period”.
When that criteria is applied to long-running historical tide guage SLR/MSL data for Auckland, Wellington, and Sydney, the long-term monotonic linear rate is effectively “natural climate variability over a considerable time period” if the data is essentially linear and monotonic. It certainly is in the case of Wellington at least.
In other words, there has been no change from “natural climate variability over a considerable time period” that can be “attributed directly to human activity”.
Upthread can be found plenty of reference to NOAA’s moving 5 yr 50 year trend analyses of Auckland and Sydney at their Tides and Currents website. Mid 20th century rates were higher than the latest 50 year trends.
Again, there has been no change from “natural climate variability over a considerable time period” that can be “attributed directly to human activity”.
So in respect to tide guage data in those locations, recommendation [188] has already effectively been satisfied. And in respect to the Pacific Ocean satellite MSL data, recommendation [188] has also already effectively been satisfied.
>”But Lovejoy’s approach is not what the review is calling for (I think Lovejoy was debunked by McIntyre anyway, maybe wrong).”
No, it was William Briggs:
‘Lovejoy’s New Attempt To Show We Are Doomed Does Not Convince’
And,
‘Yet Another Author Claims Statistically Significant Temperature Change. 99.999%!’
http://wmbriggs.com/?s=lovejoy
Also,
‘Abusing statistics in the name of global warming’ – JoNova
http://joannenova.com.au/2014/04/ask-stephan-lewandowsky-anything-except-please-can-i-have-that-data/
And,
‘Lovejoy says 99.9% certainty of AGW could be only 5% by 2019 if ‘pause’ continues’
http://hockeyschtick.blogspot.co.nz/2014/09/lovejoy-says-999-certainty-of-agw-could.html
This is on the front page of today’s Christchurch Press today
I can’t see anything. Have a link?
http://www.stuff.co.nz/the-press/news/82460594/parts-of-coastal-hazards-report-deemed-misleading
It is on the front page of the print edition today
Link here at Stuff:
Parts of coastal hazards report deemed ‘misleading’ – TINA LAW, July 26 2016
A controversial coastal flooding and erosion report took only 20 days and aspects were “misleading” and “not fit for purpose”, a panel of scientific experts has found.
The panel identified a series of shortcomings after it was set up to provide the Christchurch City Council with an impartial view on a report that identified thousands of properties could be susceptible to erosion and coastal inundation.
But, the overall Tonkin and Taylor Coastal Hazard Assessment Report was deemed fit for purpose by the panel – only once certain changes and calculations were made.
More>>>>>
http://www.stuff.co.nz/the-press/news/82460594/parts-of-coastal-hazards-report-deemed-misleading
From Stuff:
“Christchurch Coastal Residents United (CCRU) member Warwick Schaffer, who was a member of the community reference group which determined the panel’s makeup and terms of reference, said the group had several questions regarding the panel’s findings, including its apparent acceptance of a 1 metre sea level rise over 100 years.”
‘4 New Papers: Anthropogenic Signal Not Detectable in Sea Level Rise’
By Kenneth Richard, 1. August 2016
1. Hansen et al., 2016
2. Palanisamy, 2016
3. Hadi Bordbar et al., 2016
4. Dangendorf et al., 2016
http://notrickszone.com/2016/08/01/all-natural-four-new-scientific-publications-show-no-detectable-sea-level-rise-signal/#sthash.WhSmMlEk.dpbs
>2. Palanisamy, 2016
Document type : Theses
Present day sea level: global and regional variations
Hindumathi K. Palanisamy (2016)
Abstract : […]
In the second part of the thesis, by making use of past sea level reconstruction, we study the patterns of the regional sea level variability and estimate climate related (global mean plus regional component) sea level change over 1950-2009 at three vulnerable regions: Indian Ocean, South China and Caribbean Sea. For the sites where vertical crustal motion monitoring is available, we compute the total relative sea level (i.e. total sea level rise plus the local vertical crustal motion) since 1950. On comparing the results from these three regions with already existing results in tropical Pacific [Palanisamy et al (2015) – see below), we find that tropical Pacific displays the highest magnitude of sea level variations.
In the last part of the thesis, we therefore focus on the tropical Pacific and analyze the respective roles of ocean dynamic processes, internal climate modes and external anthropogenic forcing on tropical Pacific sea level spatial trend patterns since 1993. Building up on the relationship between thermocline and sea level in the tropical region, we show that most of the observed sea level spatial trend pattern in the tropical Pacific can be explained by the wind driven vertical thermocline movement. By performing detection and attribution study on sea level spatial trend patterns in the tropical Pacific and attempting to eliminate signal corresponding to the main internal climate mode, we further show that the remaining residual sea level trend pattern does not correspond to externally forced anthropogenic sea level signal. In addition, we also suggest that satellite altimetry measurement may not still be accurate enough to detect the anthropogenic signal in the 20-year tropical Pacific sea level trends.
https://tel.archives-ouvertes.fr/tel-01317607/document
Is anthropogenic sea level fingerprint already detectable in the Pacific Ocean?
H Palanisamy, B Meyssignac, A Cazenave and T Delcroix (2015)
http://iopscience.iop.org/article/10.1088/1748-9326/10/8/084024/meta
Also reproduced in Thesis above.
# # #
Impossible to “detect the anthropogenic signal in the 20-year tropical Pacific sea level trends” when much of those trends are negative i.e. sea level fall.
Coconut crops threatened by sea level rise
http://www.radionz.co.nz/international/programmes/datelinepacific/audio/201808992/coconut-crops-threatened-by-sea-level-rise
4′ New Papers: Anthropogenic Signal Not Detectable in Sea Level Rise’
By Kenneth Richard
Below are highlighted summaries from 4 peer-reviewed scientific papers published within the last few months.
1. Hansen et al., 2016
2. Palanisamy, 2016
3. Hadi Bordbar et al., 2016
4. Dangendorf et al., 2016
http://notrickszone.com/2016/08/01/all-natural-four-new-scientific-publications-show-no-detectable-sea-level-rise-signal/#sthash.xlBjTcEr.RSr8VYff.dpbs