
— by Barry Brill, Chairman of the NZ Climate Science Coalition
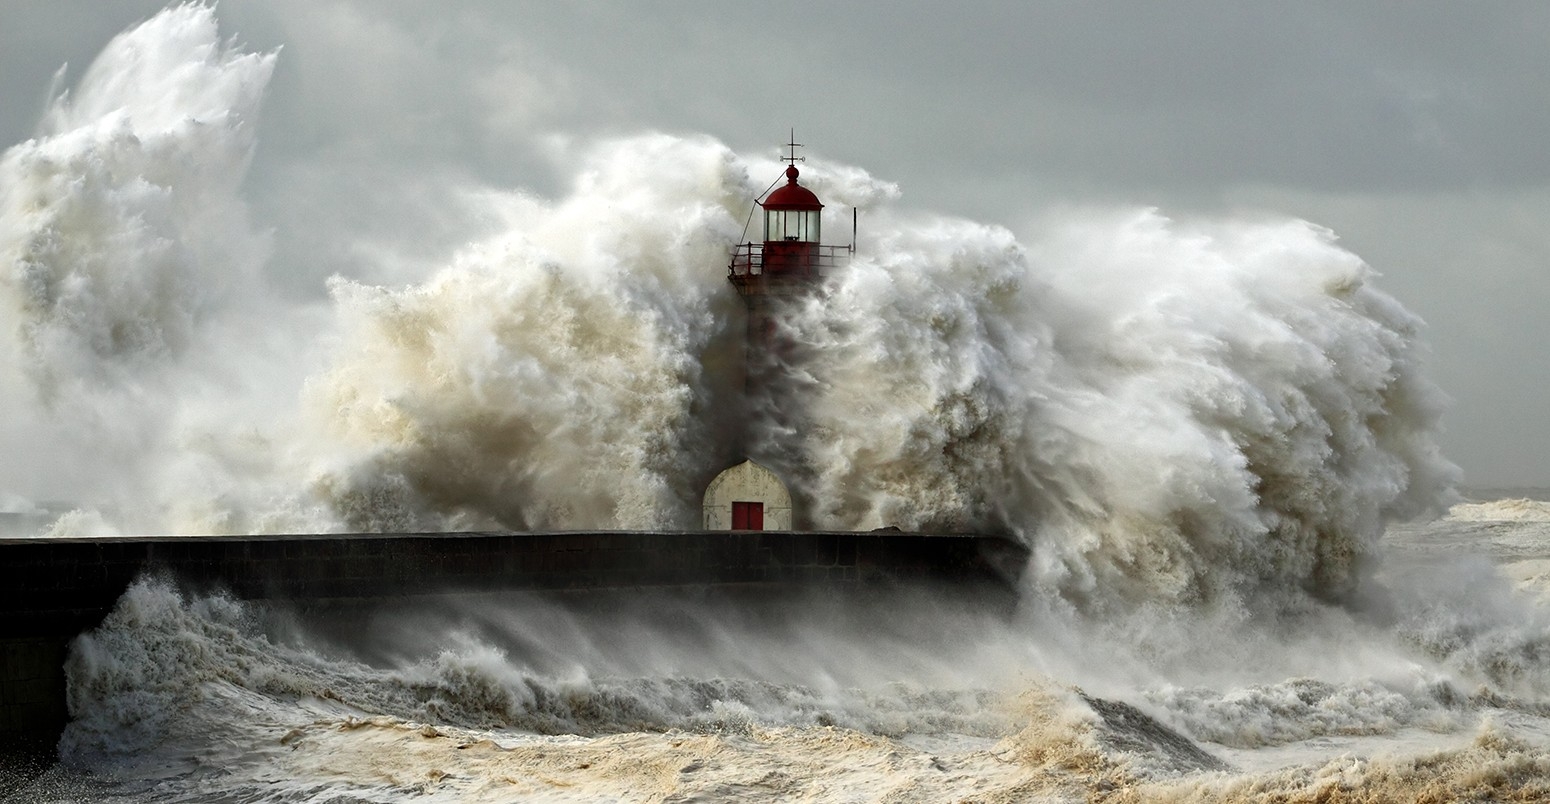
2017 was a year of extreme weather, especially in the USA with Hurricanes Harvey, Irma, and Maria devastating swathes of the country, while western states suffered from a severe drought and consequent bushfires. The year ended with a record-breaking “deep freeze”.
New Zealand also had its weather travails, with NIWA reporting a “marine heatwave”, bringing rainfall records, accompanied by heavy flooding, to parts of the South Island.
Some elements of the media hold the view that such events are a product of Climate Change. They contend that anthropogenic global warming (AGW) has already become “dangerous”.
The media use the term “Climate Change” in the specialised sense of the definition in Article 1.2 of the UN Framework Convention on Climate Change (UNFCCC):
“Climate change” means a change of climate which is attributed directly or indirectly to human activity that alters the composition of the global atmosphere and which is in addition to natural climate variability observed over comparable time periods.
The objective of this Treaty (set out at Article 3) is to stabilise the level of atmospheric concentrations of greenhouse gases, so as to “prevent dangerous anthropogenic interference with the climate system”. (emphasis added)
The hypothesis
There is a possible (but strongly disputed) chain of causation between the world’s current level of human-related emissions of greenhouse gases (“Emissions”) and, say, a hurricane in Puerto Rico. The links in this chain are claimed to be:
- Emissions have increased the atmospheric concentrations of CO21, which have in turn contributed to an increase in global average2 surface temperatures (Warming)3 of up to 0.5°C since the 1950s.
- IF the September 2017 sea surface temperatures (SSTs) in the tropical Atlantic were materially4 higher than normally appears after an El Nino5, then: (a) Warming might have contributed to those SSTs; and (b) the additional energy might have contributed to the intensity of Maria, to the extent of that excess.
- IF Warming has caused eustatic sea level rise to accelerate since 1993, this might have exacerbated the Maria storm surge (by about 2 centimetres).
Where is the evidence?
Evidence does not, and cannot ever, show that any particular weather event is attributable to Emissions. Weather is a chaotic non-linear system which is caused by unpredictable interactions between a plethora of influences. Lorenz famously posited that a tornado might be the outcome of a distant butterfly flapping its wings a few weeks earlier.
Most scientists accept that Warming is a macro trend that cannot logically be related to any single local occurrence.
What are the trends?
It is often claimed that causation can be inferred from correlation; i.e., it is assumed that the frequency or intensity of certain types of events (e.g., droughts) have recently trended upwards in lockstep with observed Warming trends. But those assumptions are usually found to be baseless, when the scientific literature is consulted:
- Globally, the Accumulated Cyclone Energy Index—which measures the combined intensity and duration of all cyclones (or hurricanes) in all three tropical oceans—is currently running 20% below its long-term average. In fact, the index for 2017 was less than half of normal cyclone activity for the Southern Hemisphere.
- A 2017 study in the Journal of Hydrology by G.A. Hodgkins of the U.S. Geological Survey concluded that the number of major floods in natural rivers across Europe and North America has not increased in 80 years. Globally, too, floods have decreased in recent years. (Wall Street Journal 12/01/2018).
- A study published in 2017 by Qinjian Jin and Chien Wang of MIT in the journal Nature Climate Change reported that the Indian summer monsoon has strengthened in the last 15 years, and that since 2002 monsoon rainfall has increased significantly.
- The number of wildfires in California has actually been declining for 40 years, according to UCLA’s Jon Keeley, a leading researcher on the subject. A review published in 2016 by Britain’s Royal Society documented that the global area burned by wildfires has also declined in recent decades.
- As for drought, a comprehensive database published in 2014 in the journal Nature found that the proportion of the world suffering from abnormally low rainfall has slightly declined since the 1980s.
- On average, the globe suffers some 325 catastrophic natural disasters a year, but last year (through November) they were down to around 250, according to the Centre for Research on the Epidemiology of Disasters at the University of Leuven in Belgium. A third fewer people were killed by climate-related hazards, according to the Centre’s International Disaster Database.
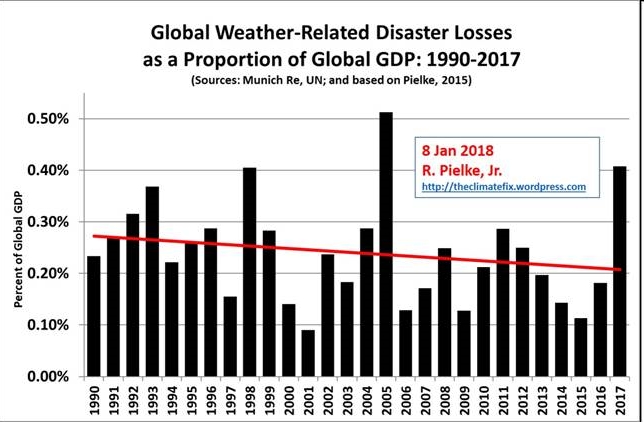
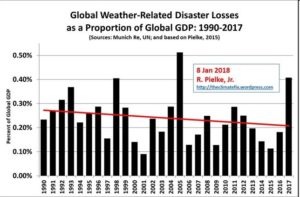 Dr Roger Pielke Jr, a world-leading researcher in this area, has demonstrated that the annual costs of weather disasters (data from Munich Re) as a proportion of global GDP (data from the UN), have been declining from 1990 to 20176. The highest year in that period was 2005 (Katrina) with 2017 next. His paper includes an illuminating graph:
The literature suggests adverse weather effects are unlikely to occur for some decades. Richard Tol’s The Economic Impact of Climate Change (pdf, 206 KB), summarising the 14 peer-reviewed studies of the 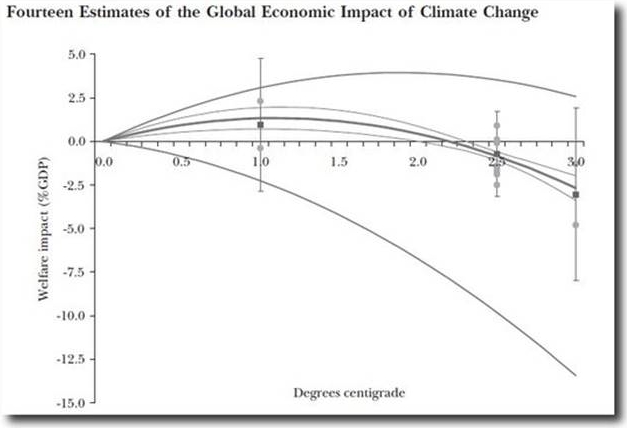 welfare effects of Warming, concludes that its net effects are initially beneficial and will not begin to produce adverse impacts until Warming exceeds 2.2°C:
The great majority of countries have ratified the Paris Agreement of 2015, which refers to averting the “threat” and “risk” of Climate Change, and seems incompatible with the hypothesis that those threats and risks have already been translated into real events. The Agreement carries the promise that dangerous AGW can still be averted if collective efforts succeed in “holding the increase in the global average temperature to well below 2.0°C above pre-industrial levels.” The average temperature was then only 0.85°C above pre-industrial levels.
What is the authority?
The fallacy of appeals to authority dates back to Aristotle and is scorned as argumentum ad verecundiam by logicians. The Royal Society’s famous motto – Nullius in Verba – urged members to “take nobody’s word for it”, because science should always be based on evidence. However, when there is no evidence (as in most climate science) it is natural to resort to the best judgment of experts.
The model-driven science of Climate Change is heavily politicised and diverse views on many of the key issues are promoted by activists and lobbyists of every hue. A very diverse spectrum of views appears in the scientific literature and an individual climate scientist can readily be found to testify to any angle a journalist might prefer to pursue.
However, climate-related policy-making, at all levels, generally regards the consensus opinions set out in reports of the Inter-Governmental Panel on Climate Change (IPCC) as the authoritative source of scientific advice. The common acceptance of this AR5 consensus is widely seen to be essential in order to make progress. It is referred to as the “mainstream” or “orthodox” scientific view.
On the physical science, the report of Working Group 1 (WG1) in the Fifth Assessment Report (AR5) of 2013-14 is the most recent authority. The many authors of WG1 are quite clear that neither hurricanes nor droughts ought to be attributed to Warming:
In some aspects of the climate system, including changes in drought, changes in tropical cyclone activity, Antarctic warming, Antarctic sea ice extent, and Antarctic mass balance, confidence in attribution to human influence remains low due to modelling uncertainties and low agreement between scientific studies. (10.3.1, 10.5.2, 10.6.1)
Similar comments are to be found in WG2 (2014) (pdf, 98MB), which deals more closely with the weather impacts of Warming, and in SREX (2012), the IPCC’s 582-page special report on management of extreme effects.
Conclusion
Climate scientists, meteorologists, economists and Governments appear to have arrived at a rare consensus – albeit by different paths – that recent extreme weather events can not be attributed to human activities.
They should combine forces to fact-check those members of the media who find it too difficult to pass up the lure of a dramatic story.
1 “CO2” is used as shorthand for the carbon-dioxide-equivalent of all greenhouse gases.↩
2 Those climatic regions that become warmer will exceed (in area and intensity) those that become cooler. The rate of Warming will vary by region.↩
3 WG1 found that more than half of the observed Warming during 1951-2012 (0.22°C+) was due to human influence.↩
4 SSTs causing hurricanes are 30°C+, so the average Warming of 0.5°C would be an increase of only 1.7%. However, most Warming is observed in high latitudes, so average tropical Warming would be less than 1%.↩
5 There is no evidence that this was the case. The 2016-17 El Nino released record quantities of heat.↩
6 Loss trends (nominal) are explained entirely by societal change.↩
Views: 1010
Attribution is difficult but not impossible for individual events. https://www.nap.edu/catalog/21852/attribution-of-extreme-weather-events-in-the-context-of-climate-change
Probabilities are changing in known directions. Extreme rainfall events are clearly increasing with the rise in temperature. https://www.nature.com/articles/nclimate2941.epdf
“Did humans cause 2017’s extreme weather events?” The answer is ..no. Rather stupid question, I would have thought.
Are you being ironic or are you genuinely puzzled that anyone thinks we might have caused them?
I would have thought by now , Richard, you would have twigged onto the fact that the “greenhouse effect” and “greenhouse gases” are about as real as fairies at the bottom of the garden.
The lack of any “greenhouse effect” and hence, any such thing as “greenhouse gases” is explained in this comment……
https://wattsupwiththat.com/2017/11/24/can-a-cold-object-warm-a-hot-object/#comment-2685034
Read carefully that comment of mine and come back at me with any questions you may have.
Mack, your comment on WUWT was, I thought, effectively demolished by Willis Eschenbach.
Perhaps you have a different definition of “greenhouse effect” to mine? Whether it exists is moot. One explanation I have seen (sorry, forgotten the URL, but it is on YouTube) suggests that the surface temperatures of the various planets is a direct result of atmospheric pressure. Certainly if the second law of thermodynamics applies the hypothesis would appear to be correct (compressing the atmosphere would generate heat), but does the second law apply to the atmosphere of a planet? It is not a closed system.
If the greenhouse effect does exist the argument reduces to the relative contributions of water, carbon dioxide, and methane and the other gases which can absorb IR radiation.
Hi Gary,
Willis Eschenbach just ends his arguement with …”sigh”. He spent the whole thread argueing in defence of Trenberth’s looney Earth Energy Diagrams which uses the false, unreal, incoming solar radiation of 340 watts/sq.m arriving at the Top of the Atmosphere (TOA). You’ve not realised that every scientific institute on the planet has made this mistake…..mistake about an AVERAGE, in solar radiation at the TOA.
“surface temperatures of the various planets is a direct result of atmospheric pressure”
You’re rehashing a pressure thermal gradient theory.. that if you read in that thread just before my comment, even Willis Eshenbach scoffs at. This is the quack theory than Doug Cotton has been ranting, railing and blathering about on the internet for years. He’s got this theory from Hans Jelbring . My confrontation with Doug Cotton is here, Gary….
http://principia-scientific.org/is-no-greenhouse-effect-possible-from-the-way-that-ipcc-define-it/#comment-1146
Don’t neglect to read the included links , Gary.
If you followed Doug Cotton’s ideas, it seems that the people who will survive this catastrophic global warming will be the ones with the strongest eardrums.
“other gases which can absorb IR radiation”.
The “absorption of IR radiation” wrt CO2 needs to be looked at here, Gary..
http://jennifermarohasy.com/2011/03/recycling-of-heat-in-the-atmosphere-is-impossible/#comment-476272
Note the science presented by Nasif Nahle just above that.
NIWA is attributing some of today’s destructiveness from the ex-Fehi weather system to anomalously high Tasman Sea surface temperatures: https://twitter.com/NiwaWeather/status/958849153093681152
Of course it’s “anomalously high”. It’s left over water from the big El Nino we’ve had for the last one or two years, which is making it’s way back across the Pacific. The hot blob will soon dissipate.
Yes Simon, it certainly seems probable that the current weather system is related to the “marine heatwave” which has come across the Tasman and raised SST’s around New Zealand by an average of about 3°C. In turn, NIWA attributes this to the La Nina conditions that commenced in September 2017. Check the hyperlink in para 2 above.
ENSO has been driving weather in the SW Pacific for thousands of years. It is probably the best-known example anywhere of ‘natural variation’. Neither NIWA nor any other climate professionals suggest this oscillation is caused by AGW.
Here is the background science:
https://earthobservatory.nasa.gov/Features/RisingCost/rising_cost5.php
Here is the reality:
https://www.washingtonpost.com/news/posteverything/wp/2017/09/07/irma-and-harvey-should-kill-any-doubt-that-climate-change-is-real/?utm_term=.d46a3fb7e0d7
Irma and Harvey should kill any doubt that climate change is real
We can’t afford to keep pretending.
By Michael E. Mann, Susan J. Hassol and Thomas C. Peterson September 7, 2017
Where has the heat come from?
https://www.theguardian.com/environment/climate-consensus-97-per-cent/2018/jan/26/in-2017-the-oceans-were-by-far-the-hottest-ever-recorded
Climate scientists warned us man-made global warming would change the climate. Make extreme weather events worse. The Royal Society, National Academy of Sciences, American Association for the Advancement of Science, American Physical Society, American Chemical Society etc etc etc endorsed the science.
We are in the shit.
https://www.nature.com/articles/ncomms16101
The unprecedented 2015/16 Tasman Sea marine heatwave
The Tasman Sea off southeast Australia exhibited its longest and most intense marine heatwave ever recorded in 2015/16. Here we report on several inter-related aspects of this event: observed characteristics, physical drivers, ecological impacts and the role of climate change. This marine heatwave lasted for 251 days reaching a maximum intensity of 2.9 °C above climatology. The anomalous warming is dominated by anomalous convergence of heat linked to the southward flowing East Australian Current. Ecosystem impacts range from new disease outbreaks in farmed shellfish, mortality of wild molluscs and out-of-range species observations. Global climate models indicate it is very likely to be that the occurrence of an extreme warming event of this duration or intensity in this region is respectively ≥330 times and ≥6.8 times as likely to be due to the influence of anthropogenic climate change. Climate projections indicate that event likelihoods will increase in the future, due to increasing anthropogenic influences.
https://www.youtube.com/watch?v=blkqV6ahXSs&list=UUTHZbk9nPwc3RmPl2izhChA&index=8
Psychology and global warming: why we can’t seem to prevent the coming disaster (revised 2016). Jerry Kroth
Our resident AGW brainwashed loon , Horne… sends us off to this lefty, Californian, psycologist Jerry Kroth…I found this AGW deluded clown so wearisome with this endless psycological blather that I didn’t bother to see the whole diatribe through. However, I did pick up on a few lines I’ve seen about on a previous occasion….
http://jennifermarohasy.com/2016/10/wettest-september-record-murray-darling/#comment-582536
How are humans responsible for the Northern Hemisphere’s long and cold winter of 2017/2018?
http://notrickszone.com/2018/02/21/the-long-winter-of-2017-18-numerous-records-set-as-ferocious-cold-and-snow-batter-northern-hemisphere/#sthash.BVt2n2g6.dpbs
The current, now passing, ‘warm blob’ affecting NZ is part of a recurring lunar tidal wave which repeats on 18-5-18 etc. cycles. Possibly exacerbated by collected enso remnants. These were much warmer at source, but cool only slowly because of their immense volume.
In fact, enso cycles are failing to produce full Kelvin waves now because of the ‘Quiet Sun’ which is deficient in penetrating UV/EUV. But they still tend to try and start up as the moon comes over the equator every c.2.5 yrs IIRC. There are some who have studied this deeply over at ‘Tallbloke’s Talkshop’. This QS effect is new to anyone now alive, though the global ocean heat cycles are similar to those of c. 1955-62 (C.63yrs). I suspect that Antarctic Deep Bottom Water current meanders have a strong bearing too. As the Astrophysicist Piers Corbyn says, we now go into a ‘mini-little ice age’. Hence the vigourous meridional weather across latitudes. With the expected greater temperature changes, because of short-cutting between warmer and colder latitudes. Jetstream wander etc.. All happenning as I write…..Brett
For years NIWA has been telling us that we have experiencing warmest months, warmest summers etc.
Now it appears, NZ’s Summer temp has only just overtaken the Summer of 1934/35.
https://www.niwa.co.nz/news/five-more-days-from-the-official-hottest-summer-on-record
Goodness, what caused that hot weather, way back then?
Appears to be a combination of La Nina, a positive SAM, and a “marine heatwave”…
same as back in the 1930s…..
BUT, this time there was a HIDDEN factor – climate change.
Wonder how you measure a “hidden” temperature.
http://www.nzherald.co.nz/nz/news/article.cfm?c_id=1&objectid=12000289
They, including the Herald, are getting near the end of their tether when Jim ‘7 Stations Destroyer’ Salinger is hauled out of the sewer……
“…what caused that hot weather, way back then?”
Well, Maggie, it was probably ENSO as is always the case. But 1934 was in the midst of a burst of global warming which neither the models nor the spin-meisters have been able to explain.
However, it is almost certainly untrue that the 1934 peak was below that of 2018. Brandolino is using the Salinger 7SS, which had pre-1975 data adjusted downwards. For the pre-WW2 period, Salinger adjustments were lowering the original recorded temps by a half-degree-plus – far more than the claimed excess of 2018 over 1934.
Just to keep this post up-to-date have a look at this op-ed by Prof Roger Pielke Jr:
https://www.wsj.com/articles/some-good-newsabout-natural-disasters-of-all-things-1533331596
Or, because the Wall Street Journal has a paywall, you might read it at
https://fabiusmaximus.com/2018/08/31/fight-the-fear-see-the-good-news-about-natural-disasters
Pielke is a world-leading expert in weather damage trends and is just about to publish a second edition of his authoritative 2014 book ““The Rightful Place of Science: Disasters and Climate Change” (CSPO, 2018).
A key take-away: “The Intergovernmental Panel on Climate Change (IPCC) reported in 2014 that there has been no increase in hurricanes, floods, droughts or tornadoes within the past 30 years. And 2018 is on track to have the lowest losses from disasters as a share of global GDP since 1990.”
Brilliant, Barry. I’ll read those and maybe post a separate article. Thanks.
Well done on the misleading metrics Barry. It is the intensity not the frequency that has increased for tropical storm events consistent with a corresponding increase in sea surface temperatures.
Economic losses are contingent on a small number of events when they hit large first-world cities. Disasters in the third world don’t count, especially if the economic losses are estimated off insured value. Fire events like the huge Carr fire only count with the destruction of property, the natural capital of hundreds of thousands of forest burnt is ignored because it is federally managed. The 2018 figures will be highly contingent on what super-typhoon Jebi does in the next couple of days and whether it affects Tokyo and Kyoto. Watch Pielke Jr drop this measure like a hot potato if 2018 turns out bad, remember 2017 was the second highest ever recorded in terms of losses.
Well, Simon, what data convinces you that hurricane intensity has increased in line with minute global temperature increases? Or droughts? Or tornadoes? Or floods? Or volcanoes?
There are plenty of studies set out above which show the opposite to be true. I’ve not seen any of them rebutted.
https://www.gfdl.noaa.gov/global-warming-and-hurricanes/#recent-relevant-gfdl-papers-and-animations
https://www.neefusa.org/nature/water/increased-hurricane-intensity
https://www.niwa.co.nz/news/intensity-of-cyclones-predicted-to-increase
https://phys.org/news/2015-05-climate-frequency-intensity-hurricanes.html
https://www.researchgate.net/publication/23233989_The_Increasing_Intensity_of_the_Strongest_Tropical_Cyclones
https://www.epa.gov/climate-indicators/climate-change-indicators-tropical-cyclone-activity
http://theconversation.com/factcheck-is-global-warming-intensifying-cyclones-in-the-pacific-38984
https://www.climatecouncil.org.au/uploads/3cf983377b8043ff1ecf15709eebf298.pdf
Let’s not forget too that heat waves cause severe drops in productivity but don’t get counted in Pielke’s stats because there is little damage to infrastructure.
Simon,
You’ve supplied eight references to hurricanes. You should know that predictions are not useful, as Barry asked for observational data. But I don’t know why you’re even taking him to task over “intensity not frequency” as it was the IPCC that reported “no increase in hurricanes, floods, droughts or tornadoes within the past 30 years.” Ask them to explain or read the AR5 (I think Barry meant to say 2013 but you know that).
Heat waves haven’t increased and I suggest you look elsewhere for data on lost production, not at a study of insurance claims.
You say:
Why should increased SSTs increase storm intensity but not frequency?
Heat = energy. Cyclones need a water temperature of at least 26.5°C to be self sustaining. Warmer air can hold more water vapour. Read up sometime on why Harvey was such a devastating hurricane and attribution to exceptionally high SST.
Some amazing photos coming in from Jebi. Fortunately it has sped up and decreased to a Category 2. Looks as if it will pass right over Kyoto.
Simon,
I know. You haven’t answered the question.
I did. Unfortunately you have a perception filter on inconvenient facts.
Don’t be rude. You mentioned neither intensity nor frequency. I asked … well, you know what I asked.
Intensity is determined by differences, so the polar cyclonic zones (Screaming Sixties etc.) where noone lives take the ticket. We can expect, and are seeing worse weather because cooling has begun and loopy jetstreams follow a straighter, shorter path into warmer or colder latitudes. Yet another problem for the warmistas to fantasise answers for. Looking to the LIA would be a start, also the sixties and seventies, teens and thirties. Hot cold or stormy, we’ve already been there and have the data. As stored by Tony Heller, myself and many others.
All around the world, tree activists (including James Shaw) have been either hinting at, or claiming outright, that a range of extreme weather events have increased in recent years as a result of anthropogenic global warming. This is the whole basis of their faith that AGW is “dangerous”.
The loudest and most persistent allegations have come from USA, where views on climate science are split on political party lines (85% according to Pew surveys). The left’s fixation is with tornadoes and Atlantic hurricane landfalls over the last 20 years.
The NOAA Storm Prediction Centre has just released data showing that US tornadoes are at their lowest level in 65 years.
https://wattsupwiththat.com/2018/10/04/2018-us-tornadoes-lowest-in-65-years-of-record-keeping/
Adjusted for changes in population and reporting technology, the tornado trend over 50 years to 2007 is dead flat. 70% of all human-caused greenhouse gas emissions has made not one whit of difference. So where is the proven “danger”?
The IPCC Special Report (SR15) published last week has been reported in local media as supporting the view that the 0.87°C of warming that has already occurred since pre-industrial times (1750, but proxied by 1850-1900 temperatures) has caused an increase in the number or intensity of extreme weather events.
In fact, the new report supports both AR5 and SREX in finding no effects on cyclones, flooding, droughts, etc. https://www.dailywire.com/news/36904/uh-oh-environmentalists-un-climate-change-group-hank-berrien
Just 3 days after SR15, TVNZ’s Dan Corbett stated dogmatically on One News that Hurricane Michael was intensified by Climate Change (11 October). Yet Chapter 3.3.6 has this to say:
“Numerous studies towards and beyond AR5 have reported a DECREASING TREND in the global number of tropical cyclones and/or the globally accumulated cyclonic
energy.” (emphasis added)
After Hurricane Michael, there is still no trend in either the frequency or intensity of Florida hurricane strikes over the past 118 years, according to the data held by the US National Hurricane Centre. https://wattsupwiththat.com/2018/10/15/inconvenient-data-no-trend-in-florida-hurricane-strikes
The fear mongers (including Dan Corbett) say that the eastern Gulf of Mexico was unusually warm this summer. But Roy Spencer finds that the SST in the eastern Gulf was only the 9th warmest since 1860. 7 out of the top 10 warmest occurred before global warming even began – in the 1970s.
Extending the study to all US major (3+) hurricanes clearly shows that the numbers peaked in the 1940s and have since trended downwards.
The indefatigable Roger Pielke Jr has produced the only research to date regarding damage caused by weather extremes since 1990. https://wattsupwiththat.com/2018/10/30/new-paper-by-pielke-jr-weather-related-disasters-are-decreasing-in-costs/
Abstract: “The Sustainable Development Goals indicator framework identifies as an indicator of progress the objective of reducing disaster losses as a proportion of global gross domestic product. This short analysis presents data on this indicator from 1990. In constant 2017 US dollars, both weather-related and non-weather related catastrophe losses have increased, with a 74% increase in the former and 182% increase in the latter since 1990. However, since 1990 both overall and WEATHER/CLIMATE LOSSES HAVE DECREASED as proportion of global GDP, indicating progress with respect to the SDG indicator”. (emphasis added)
Many of our school children (and lots of politicians) seem to think that the IPCC’s Special Report on 1.5° in October 2018, forecast the end of human civilisation in about 2030. The nature of the catastrophe is never stated, but the implication is that weather events will become more extreme and wipe us out.
So, what did SR1.5 say about extreme weather? The indomitable Roger Pielke Jr gives us the relevant extracts:
https://twitter.com/RogerPielkeJr/status/1049110834767585280
Droughts: “Low confidence in the sign of drought trends since 1950 at global scale… likely to be trends in some regions of the world, including increases in drought in the Mediterranean and W Africa & decreases in droughts in central N America & NW Australia”
Floods: “There is low confidence due to limited evidence, however, that anthropogenic climate change has affected the frequency and the magnitude of floods.”
“In summary, streamflow trends since 1950 are non-statistically significant in most of the world’s largest rivers (high confidence)”
Cyclones: “Numerous studies towards and beyond AR5 have reported a decreasing trend in the global number of tropical cyclones and/or the globally accumulated cyclonic energy. Though some basins see up trends, some down.”
“There is only low confidence regarding changes in global tropical cyclone numbers under global warming over the last four decades.”
“There is consequently low confidence in the larger number of studies reporting increasing trends in the global number of very intense cyclones.”
Tornadoes: Not mentioned.
Bottom line. The IPCC once again reports that there is little basis for claiming that drought, floods, hurricanes, tornadoes have increased at all, much less increased due to GHGs.
I have just encountered a major international study of Southeast Asia and the Pacific (including New Zealand) for the 38 years from 1961 to 1998 which found that the number of rain days had decreased as had the frequency of extreme rainfall events. “Trends in the average intensity of the wettest rainfall events each year were generally weak and not significant.”
So, during the period when the temperature trend was at its maximum, both the frequency and the intensity of extreme rainfall events were decreasing – not increasing.
The paper is Manton et al (2000). BOM, CSIRO, NIWA and the climate agencies of 13 other countries were represented by authors.
https://www.academia.edu/23390839/Trends_in_extreme_daily_rainfall_and_temperature_in_Southeast_Asia_and_the_South_Pacific_1961-1998?email_work_card=title
Barry, interesting to see NIWA just claimed last few months near record warmth. Myself, in Northland too, I have been back in my fleecy vests most of the time even now. When the southerlies blow, and that is most of the time too. These lows run down to near the Ice. Compliments of the Season. Brett Keane