

Private prejudice
The Parliamentary Commissioner for the Environment, Dr Jan Wright, published a report last month, Changing climate and rising seas: Understanding the science (pdf, 2MB). While reading it I marked more than a hundred places where her evidence or reasoning is questionable. This post discusses some of those.
The commissioner’s errors cause concern—just as errors from any prominent public servant[1. Dr Wright is highly paid. The Vote for the Parliamentary Commissioner for the Environment in 2014/15 provides for an annual remuneration of $296,000 in a total departmental budget of $3,258,000.] cause concern—and her agitation for policy change means she sides with environmental activists against at least half our population, and possibly even three-quarters of our population—those who are not persuaded that global warming is a problem. You can see that this arises directly from her personal views, for, with her opening words, the commissioner admits that her belief in dangerous anthropogenic global warming (DAGW) has been around for 35 years:
I first heard about climate change in 1979.
But she appears oblivious to that potential bias when she immediately presents it as a virtue:
During my seven years as Commissioner, I have consistently said that climate change is the biggest environmental issue we face.
So, knowing where she stands, we are hardly surprised to witness her unabashed activism or her staunch resolve to press on regardless of the evidence. Under the legislation her position is established as an “independent” officer of Parliament and “the acceptance and effectiveness of the PCE’s advice depends [sic] to a large degree on the independence, integrity and quality of the investigations undertaken by the office” [emphasis added].
Of greatest concern is her readiness to promote policy without providing evidence of a real problem or its causes, and without examining a range of competent, cost-effective solutions. Let us look at the details.
History of sea level
The report says:
Over the last century, the average sea level around the world has risen by about 20 centimetres. – Overview (p.5)
Then restates it three times:
However, since about 1900, sea levels have risen by about 20 centimetres. – Introduction (p.9)
In 1941 the seismologist Beno Gutenberg analysed historic records from 69 tide gauge stations from around the world and found that since around 1900, the sea had been rising at a rate of about 1.1 millimetres a year – Chapter 2 (p.17)
Data from tide gauges around the world have been collated and show that average sea level has been rising since the beginning of the twentieth century. Figure 3.5 shows that global average sea level has risen by about 20 centimetres since then. – Chapter 3 (p.31)
(A sea-level rise of 20 cm from 1900 to 2010 equates to about 1.8 mm/yr.) The IPCC says that sea level hardly changed from AD 0 to the 20th century, when it rose at about 1.7 mm per year (AR4). In reiterating the IPCC belief the commissioner leaves the reader with the misleading impression that sea level rise began in 1900. Saying it four times ensures a firm impression, but it’s still misleading.
Why do they say this? An obvious reason would be that the later they can place the beginning of warming, the stronger the suggestion can be that we caused it, because the whole thrust of the IPCC has been to prove that dangerous warming is being caused by humanity. The question of why that should be is not mine to answer.
Professor Judith Curry examined the IPCC statement, making the surprising discovery that the IPCC gives no references for it. Prof Curry actually found many studies that show “relatively static sea levels after the initial Holocene rise” (about 7000 years ago) followed by further fluctuations well before the 20th century.
The IPCC is wrong to claim that sea level has remained unchanged for 2000 years or more to 1900. From which it follows that Commissioner Wright is also wrong. From the historical evidence, observed 20th century rates of rise around New Zealand of about 1.8 mm/yr (180 mm/100 yrs) are completely unremarkable.
The NIPCC Policy Brief Commentary and Analysis on the Whitehead & Associates 2014 NSW Sea-Level Report by Carter et al. (2014), notes that sea level varies around the world and over the short and long term (p.15).
Around the world, significant regional variations occur in the rate and direction of sea-level change;
when attempts are made to estimate global sea-level from studies at specific locations, it is found to vary through time.
The IPCC published a time series of sea levels from Northern Europe in the TAR (2001):
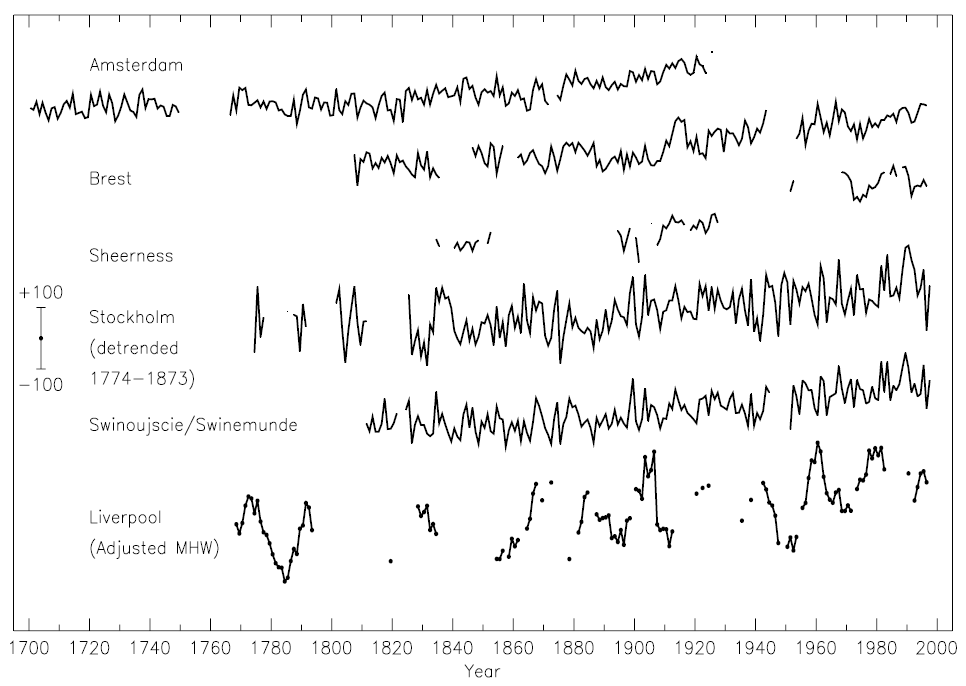
The IPCC claims that sea level rise resumed in 1900 and presents these graphs from six European harbours to show that, but just look at them and they tell a different story. Sea level started rising in Amsterdam in 1805, at Brest it was rising about 1850, and at Stockholm and Swinemunde by 1860. It is difficult to determine when levels began to rise at the last two harbours, Sheerness and Liverpool, but perhaps it was 1900.
So warming began at least about 1800, or well before humanity could have caused it. It seems generally acknowledged that if anthropogenic carbon dioxide has caused significant warming then it is unlikely to have been before the 1950s (not 1900, as the commissioner claims).
The process of attributing global surface warming to human emissions is contentious and lacks precision. The IPCC estimates the observed warming from 1951 to 2010 (60 years) was approximately 0.6°C to 0.7°C. Then they claim that “more than half” of that increase was caused by our activities. But that’s a lot of guessing.
Commissioner Wright is wrong about the history of sea level.
Future of sea level
The Overview states:
The Intergovernmental Panel on Climate Change (IPCC) expects [sea level] to rise … 30 centimetres or so by the middle of the century and up to a metre or more by the end of the century – (p.5).
I found that statement in the AR5 (Chp 13 Sea level change, p.1181). It’s at the high end of the IPCC scenarios.
This expectation of sea level rise comes not from any historical record—it’s not a projection from real-world observations—but from computer climate models whose predictive skill is widely questioned. Professor John Christy said a few days ago in a public comment concerning climate models to the US Environmental Protection Agency (EPA) (pp 2-3) that the models are not suitable for future projections because they fail to reproduce the real world.
Here is his graph showing the marked and growing discrepancy between the model output and observations.

The increasing divergence between model output and observed temperatures began about 1990 (35 years ago), or even earlier. Why should we believe the models? Why does the UN tell us the world is warming just as the models predicted? Click to enlarge.
He described a scientific test that proves this beyond a shadow of a doubt. In numerous experimental runs of an international set of climate models using historical data, all the models consistently display one significant warming response—rapid heating in the tropical atmosphere if the atmosphere were being warmed by greenhouse gases.
But that region is not warming, which means the models are consistently producing, since about 1996, an incorrect response to greenhouse gases. This should have been acknowledged as a failure by the IPCC because the AR5 has evidence of it, hidden away in the Supplementary Material.
Thus, the models are not suitable for predictions of temperature, precipitation, humidity, droughts, storms or sea level because they predict significantly more warming than is observed and therefore more sea level rise, etc., than is warranted.
Commissioner Wright is wrong about future sea level.
History of climate
The Introduction says:
… over the last few thousand years the climate has been relatively stable …
Calling it ‘relatively’ stable might prevent an allegation of negligence, but the statement is still misleading. Here are three studies that describe both steady and sudden Holocene climate change:
1. Overpeck and Webb 2000. Nonglacial rapid climate events: Past and future. Proceedings of the National Academy of Sciences USA 97: 1335-1338.
2. Mayewski et al. 2004. Holocene climate variability. Quaternary Research, Vol 62, Issue 3, 243-255.
3. Bush, A.B.G. 2004. CO2/H2O and orbitally driven climate variability over central Asia through the Holocene. Quaternary International, Vol 136, Issue 1, 15-23.
The report repeats the statement about climatic stability:
The last seven thousand years has been a time of relative climatic stability, but this is now changing – Chapter 2 (p.13).
The occasional similitude of stability more likely proceeds from a lack of evidence than a lack of climate change, for the more it is studied, the more change is discovered. Climate is nothing if not changeable and in truth the modern climate is unremarkable.
Commissioner Wright is wrong about climate stability.
Greenhouse gas warming
There is a strong consensus among scientists that rising sea levels are largely a consequence of increasing concentrations of carbon dioxide and other greenhouse gases in the atmosphere raising global temperatures. – Introduction, p.9.
Yes, there is a consensus to that effect among a small number of scientists, yet science knows of no mechanism for it. Not a single paper has been published which purports to describe such a mechanism, which comes as a shock to most people. It’s especially surprising when you reflect on the vital importance to the warmist case for the air to possess the ability to warm the ocean, since that’s the only way for us to be blamed for sea level rise. There is a general consensus that carbon dioxide warms the atmosphere a little by slowing down the passage of long-wave infrared radiation to space, although the magnitude of the warming is uncertain and in dispute.
But the capacity of the atmosphere significantly to heat the ocean is highly contentious and no mechanism has been scientifically determined. Let me repeat that: there is no known mechanism whereby the air can significantly heat the ocean. The only reference I’ve come across in about eight years of studying the subject is an unpersuasive article on the Real Climate blog. It’s reasonable to suppose that some heating will take place but there’s not a single scientific paper describing it, even though it’s vital to the alarmist case to completely dismember our fossil-fuelled transport and industry.
Imagine aiming a hair dryer at a cold bath and expecting the water to warm up—it ain’t going to happen. But that’s no reason, apparently, for lots of people not to claim that it does happen. Including our esteemed Parliamentary Commissioner for the Environment, Jan Wright.
If you think I’m wrong, please write and let me know, citing the paper or observational evidence that shows I’m wrong. This is so important that I would very much rather be corrected than to continue in ignorance—so I won’t be annoyed with you.
Until I receive that information, Commissioner Wright is wrong about ocean warming caused by our greenhouse emissions.
Acceleration of sea level rise
Has sea level rise accelerated in recent decades?
The short answer is no, but the report claims, echoing the IPCC, that sea level will rise by 300 mm by 2050. Richard Cumming kindly superimposed that 300 mm increase on this record of sea level observations at Wellington. The black line shows the trend of the natural rise and the red line tracks the excursion that is predicted by the IPCC. The natural trend has only 35 years left to meet the end of the red line—at 8.6 mm per year instead of only 1.8 mm/yr. The rise must accelerate to five times faster than it’s ever risen in the last century and longer.

Historical record of sea level at Wellington. Red line shows projection issued by IPCC and echoed uncritically by Commissioner Wright. Shows the outlandish acceleration needed to meet the IPCC’s guess. Click to enlarge.
The rise is supposed to be caused by the sea expanding through being warmed by the air as its temperature rises, only it hasn’t risen for about 20 years. The hypothesis that the air might warm the ocean has other problems as described above: physics is against it.
The NIPCC report Climate Change Reconsidered II: Physical Science refutes the idea of sea level rise acceleration:
The IPCC’s 2007 report projected global sea level was likely to rise by somewhere between 18 and 59 cm by 2100, and at an accelerating rate. … However, multiple analyses of tide gauge and satellite records make it clear rates of global rise around 10 mm/y do not, and are not likely to, occur. … Though it is only an inadequate 20 years long, the satellite radar altimeter record also displays a recent deceleration of sea-level rise – Chp 6, Observations: The Hydrosphere, p.754.
Then it says:
The IPCC (2001) wrote “no significant acceleration in the rate of sea-level rise during the 20th century has been detected” – p.771.
The satellite data, which began in 1991, estimate a higher rate of rise than tide gauge data but there’s no evidence of acceleration. Finally, the NIPCC says:
Hannah and Bell (2012) analyzed four 100-year long records from New Zealand’s four biggest ports (see Figure 6.2.1.5.1) and found no acceleration beyond the average linear rate of rise of 1.8 mm/yr. – page 772.
So Commissioner Wright is wrong about the acceleration of sea level rise.
We’ll look next at Chapter 2, in which the ancient past is described as highly variable and completely independent of carbon dioxide, informs us that apparently modern variability (which, amazingly, is greater than ever before) is caused only by carbon dioxide.
Views: 450
Great that you’ve made this an exhaustive 2 part series – good work RT (worth waiting for)
But first to clear up a misconception that Dr Jan Wright has precipitated.
>”The black line shows the trend of the natural rise and the red line tracks the excursion that is predicted by the IPCC?” [in respect to Wellington Harbour graph]
The red line is as implied by Wrights report dated Nov 2014 i.e. Jan Wright fails to make clear the IPCC’s baseline which is 1980 – 1999 centred nominally on 1990. So any projection should be from 1990 in IPCC terms. The red line is therefore the inference from Dr Jan Wright’s report – not the IPCC. And the graph is annotated as such.
But because Wright omits that piece of vital information, the implication to anyone reading the report, most importantly the media, is that the predicted rise is over the 35 years from 2015 – 2050. This is how the NZ Herald reported it:
‘Sea levels will rise 30cm around NZ by 2050 – new report’
Isaac Davison, NZ Herald political reporter, Thursday Nov 27, 2014
“Sea levels will rise 30cm around New Zealand by 2050 and threaten coastal properties and infrastructure in low-lying areas, a new report by Government’s environment watchdog warns.”
http://www.nzherald.co.nz/nz/news/article.cfm?c_id=1&objectid=11365463
Now how is anyone, let alone a political reporter, to know that the projection should be made from 1990, not 2014/15? Dr Wright has only herself to blame for this misconception.
For this reason alone (there are several other major clangers obviously), Dr Wright’s inept report should be retracted and a correction issued. It fails the “quality” test, the level of which as indicated by the Commissioner’s remuneration should be rather higher and considerably more precise.
# # #
For the record, here’s the respective rates of rise that can be applied to Wellington:
The effective rate of Dr Wright’s projection from 2015 plus the elapsed natural rise from 1990 when taken from 1990 works out at 0.6m/century.:
@ 0.6m/century: 36cm (Wright implied by report from 2015 plus historical 1990 to 2014)
This conforms to the lowest WCC/T&T/MfE/IPCC projection (see Tonkin &Taylor/Wellington City Council report Table 2-1):
@ 0.6m/century,: 36cm (WCC/T&T/MfE/IPCC)
But when Wright’s projection is taken from 1990 (as should have been stipulated by her) the rate works out at 0.5 C/century, lower than the lowest WCC/T&T scenario:
@ 0.5m/century: 30cm (Wright/IPCC “20 to 40cm” from 1990)
>”see Tonkin &Taylor/Wellington City Council report Table 2-1″
Sea Level Rise Options Analysis – Wellington City Council
http://wellington.govt.nz/~/media/services/environment-and-waste/environment/files/61579-wcc-sea-level-rise-options.pdf
And the WCC haven’t noticed the Wright report inconsistency either:
Council Backs Sea Level Rise Report
27 November 2014
Last month the Council released its own report, ‘Sea Level Rise Options Analysis’ [hotlink but see above], to further understand and plan for the impact of climate change on Wellington.
Wellington’s Mayor, Celia Wade-Brown, says these reports are an important step toward rising to the challenge of sea-level rise in Wellington and New Zealand.
“These reports are a starting point for Wellingtonians to consider what is important to our city, what we need to think about and plan for the future. While WCC is an important leader in addressing climate change it’s an issue we can’t tackle alone,” says Mayor Wade-Brown.
“Increasing the understanding of climate change is important. It helps individuals and business think about what actions they will take in relation to their property.
“Wellington is continuing to reduce emissions and our energy use is comparatively positive. Wellingtonians use 58 Gigajoules of electricity per person annually. This compares with 81 gigajoules for an average European city and 228 gigajoules for an average Australasian city.”
The WCC commissioned analysis looks at how the capital could be affected by rising sea levels over the next century. It broadly covers cultural, economic, environmental and social values, looking at the potential impacts for different scenarios.
The Council’s Community Resilience Portfolio Leader Councillor Malcolm Sparrow says, “The Council is prioritising Wellington’s resilience and like all cities, there is much to be done. Cities are at the frontline of building resilience to natural hazards in the face of climate change.”
Councillor David Lee, Portfolio Leader for Climate Change, says Wellington City Council is already working on a number of resilience initiatives to best prepare the city for future climate change risks.
“As a council, we’re already working with the community through our city planning and through initiatives arising from the 2013 Climate Change Action Plan – such as the Water Sensitive Urban Design Guide, the Smart Energy Challenge, and working with the community to find a long-term solution for the storm damaged Island Bay seawall.”
Wellington has taken significant steps to reduce our emissions and continue to do so. The western side of Wellington has been developed with two large-scale wind farms. We have the highest commuting rates of walking and public transport in Australia/New Zealand for a city and our emissions are starting to trend downwards from 2001 levels.
http://wellington.govt.nz/your-council/news/2014/11/wcc-backs-sea-level-rise-report
# # #
Tonkin & Taylor state on page 16:
2.2 Range of scenarios
“For this study no deduction in actual sea level rise from the 1980s to the present has been made”
They should have. Given there is no acceleration (basically a monotonic rise) the long-term rise is valid for Wellington. A couple of minutes with an internet connection leads to:
Sea Level Trends – NOAA Tides and Currents
http://tidesandcurrents.noaa.gov/sltrends/sltrends.html
Wellington, New Zealand
690-011
The mean sea level trend is 2.45 mm/year with a 95% confidence interval of +/- 0.29 mm/year based on monthly mean sea level data from 1944 to 2011 which is equivalent to a change of 0.80 feet in 100 years.
How hard is that Tonkin & Taylor?
Thanks, RC.
Thanks for the correction, but I still have a problem with the report’s projection. Since the period now runs from 1990 to 2050 (correct?), we’ve had 24 years at a higher rate (0.5 m/100y, which is actually lower?), EVEN THOUGH no increase in the rate of sea level rise has been observed. So the natural rate has decreased, to be made up by an amount of anthropogenic sea level rise (which is unlikely). So, we’re still struggling to match the commissioner’s predictions to the real world. She is still wrong, right?
>”we’ve had 24 years at a higher rate (0.5 m/100y…”
No, the natural rise is 25.2mm/decade (PSMSL) or 24.5 mm/decade (NOAA).
0.25 m/100yrs.
Ah, no, that was the PCE’s forecast, (which, taken correctly) from 1990, amounts to:
>”Ah, no, that was the PCE’s forecast, (which, taken correctly) from 1990, amounts to: “…when Wright’s projection is taken from 1990 (as should have been stipulated by her) the rate works out at 0.5 C/century”
The breakdown is this:
63.06mm: 1990-2014, 25 yrs @ 252.24mm/century (natural historical PSMSL)
300mm: 2015-2049, 35 yrs @ 857.14mm/century (Wright implied)
363.06mm: 1990-2049. 60 yrs @ 600mm/century (Wright implied + natural historical)
300mm: 1990-2049, 60 yrs @ 500mm/century (as should have been stipulated by Wright)
I have never heard of this person before, but her report is wonderfully ‘on message’ to secure her a ticket on the AGW gravy train. After only a rapid perusal of this summary, I am neither shocked nor surprised, just annoyed and dismayed that the message she communicates is so damnably blatant. How on earth do these charlatans get away with this stuff inside a supposedly scientifically literate administration – what has gone wrong in our education system, especially at graduate level, that this sort of slanted and unacceptable tosh can emerge from a government advisor, and an extremely well remunerated one at that.
Yes, Alexander, I agree with you, and I don’t know what has gone wrong either. The only thing that I can think of to do that could make a difference is to keep chipping away with the tools of reason and science to reveal wrong thinking and expose the policy prescriptions for what they are: flimsy, self-serving and monstrously destructive.
This is a very important discussion to have, because when the next report comes out in 2015, it will directly affect a very large percentage of people who live in NZ close to the coast. It may impact on the insurability of their houses, how much local councils and government spend on infrastructure, etc.
Absolutely bad for us, Andy. Then multiply that by, say, 150 countries which border the sea, and you realise the scale of this global warming problem. Of course, it’s only possible because the global organisation, the United Nations, is able to distribute this global warming around the globe.
For example
http://www.stuff.co.nz/business/industries/9588487/Rising-seas-threaten-Christchurch-homes
Having insurance cover withdrawn naturally means the book value of your property reduces to zero.
Exackly! This is entirely predictable (I say, after the event). As I’ve said before, the insurance industry’s interest in climate change lends no credence to climate change whatsoever, because its interest is entirely self-absorbed. They stand to gain higher premiums as the perceived “risk” increases. They can maintain a high level of risk as long as the UN continues to ramp up the scary predictions and, when a real risk emerges and it becomes eventually too expensive to sell or truly too ruinous to insure, they can simply expunge it from their portfolios with the blessing and the kind, understanding words of their customers. “Well, you can’t expect them to carry the risk for ever, Ethel. There comes a point, you know. The sea is rising, after all.”
But as you point out, it’s no help to the property owner who has paid premiums for years before this. The government exists to protect individuals. But where is its protection from climate change?
There’s quite a lot of circular reasoning goes into the issue of insurance premiums.
The fact that premiums have gone up (in the wake of extreme weather etc) is cited as evidence for “climate change”, yet Roger Pielke Jnr found – in his latest book – that there is no evidence that rising premiums has anything to do with CC
TVNZ tonight on One News:
‘Our stormy year came at a massive cost’
Published: 6:34PM Monday December 22, 2014 Source: ONE News
Wild weather has cost the country just under $148 million in insurance payouts, the fourth most expensive year on record. The cost was down from $174 million last year when the country was hit by four major storms. “Kiwis love to live by the beach, they love to get baches by the beach, but we just need to recognise that we’re aggregating a lot of risk in areas that will be prone to flooding,” says NZ Insurance Council chief executive Tim Grafton.
The Easter storms came with the highest price tag, inflicting $55million worth of damage. The storms that lashed Auckland and the Coromandel in June resulted in the second biggest payout of $37.6 million. The top three rounded out by the one-in-100 year storm that swamped Christchurch in March, costing more than $22 million.
“Just being a weather forecaster for many years and being able to do it all around the world, I’ve noticed as well the weather is getting more erratic,” says ONE News meteorologist Dan Corbett.
The Insurance Council is calling on the Government to restrict building in coastal areas. “We don’t want to see housing in vulnerable places where we’re going to get increased flooding, because that just creates a disaster two or three decades down the track, so it’s important that we take a long view on climate change,” says Mr Grafton.
http://tvnz.co.nz/national-news/our-stormy-year-came-massive-cost-6210644
# # #
Does Mr Grafton mean man-made climate change? Or natural climate change?
Bravo. An important point. What’s the title of his book; is it available online?
>”Commissioner Wright is wrong about…..”
5 counts in just Part 1 so far.
Don’t know whether Wright’s solar case (“Milankovitch cycles”) will be addressed in Part 2 but if not here’s the issue (count 6):
Dr Jan Wright is completely out of touch with, or ignorant of, climate forcing. Anyone even remotely familiar with climate change issues knows that solar forcing is total solar irradiance (TSI) – not Milankovich cycles. Moreover, the historical and future TSI levels are one of the most highly uncertain and contentious climate parameters.
For Dr Wright to be so out of touch with this issue alone demonstrates complete incompetence. Her report should be retracted and she should step aside from climate change issues. Alternatively, fired by her employer.
Where do we stand on the solar wind moderation of gamma rays and the CERN experiments?
>”Where do we stand on the solar wind moderation of gamma rays and the CERN experiments?”
Not sure what can be said about where “we” stand. My personal stance is that it relates to solar radiance received by the surface (SSR) as a result of cloudiness changes (dimming/brightening). This has major significance in the decadal/multi-decadal timeframes but not in the bicentennial/millennial timeframes.
Over the 2 decades 1980s, 1990s, SSR increased by about +2 W.m-2 consistently worldwide but that was in between 2 episodes of negative SSR forcing:
Martin Wild, 2012: Enlightening Global Dimming and Brightening. Bull. Amer. Meteor. Soc., 93, 27–37.
doi: http://dx.doi.org/10.1175/BAMS-D-11-00074.1
WHAT OBSERVATIONS TELL.
Fig. 2. [page 29] Changes in surface solar radiation [SSR] observed in regions with good station coverage during three periods. (left column) The 1950s– 1980s show predominant declines (“dimming”), (middle column) the 1980s–2000 indicate partial recoveries (“brightening”) at many locations, except India, and (right column) recent developments after 2000 show mixed tendencies. Numbers denote typical literature estimates for the specified region and period in W m–2 per decade. Based on various sources as referenced in Wild (2009).
Average SSR USA/Europe/China-Mongolia/Japan/India:
1950s-1980s: -4.8 W.m-2
1980s-2000: +2.0 W.m-2
After 2000: -0.6 W.m-2
RECENT DEVELOPMENTS AND PERSPECTIVES.
The latest updates on solar radiation changes observed since the new millennium show no globally coherent trends anymore (see above and Fig. 2). While brightening persists to some extent
in Europe and the United States, there are indications for a renewed dimming in China associated with the tremendous emission increases there after 2000, as well as unabated dimming in India (Streets et al. 2009; Wild et al. 2009).
http://journals.ametsoc.org/doi/pdf/10.1175/BAMS-D-11-00074.1
Cloud/aerosol forcing range 1950s to 2000+:
-10 W.m-2 to +8 W.m-2. Sfc
+8 USA
+3 Europe
-4 China/Mongolia
0 Japan
-10 India
By comparison, the current rate of CO2 forcing is:
+0.3 Wm-2/decade.TOA
It is impossible to detect +0.3 CO2 forcing among SSR fluctuations at the surface of -10 to +8. Neither will CO2 forcing of +0.3 have made any difference among SSR after 2000:
# # #
SSR was obviously the radiative component of a combined atmospheric temperature driver 1950-2010 and the major driver obviously – not CO2. However, that brightening episode is not reflected in the MSL metric.
So perhaps “we” could say: no relevance to MSL.
The thermosteric component of MSL is obviously driven by a forcing operating on a considerably longer timeframe than multi-decadal (including the IPCC’s 6 decade anthro attribution period) i.e. at least bicentennial and more likely millennial.
So perhaps “we” could say: no relevance to [SLR}.
>”SSR was obviously the radiative component of a combined atmospheric temperature driver 1950-2010″
The SSR forcing was 1980 – 2000 (2 decades). The IPCC anthro attribution period is 1951 – 2010 (6 decades).
See IPCC AR5 SPM Figure 1:
http://www.easterbrook.ca/steve/wp-content/IPCC-AR5-WG1-Fig-SPM1.png
The only 2 decades of any warming were 1980 – 2000 during which the SSR forcing was operating at +2 W.m-2.
Interesting reply, thanks (sorry it was a vaguely-worded question). I was actually wondering whether CERN had confirmed a link between sunspots and TSI, which would confirm a far stronger solar forcing than is possible just through variations in solar output and (possibly) eliminate the need to account for human forcings. But I’ll look it up after I’ve worked through the pile of 60+ notes I have on NZ-related climate story suggestions.
>”I was actually wondering whether CERN had confirmed a link between sunspots and TSI, which would confirm a far stronger solar forcing than is possible just through variations in solar output”
I assume you mean a link between solar wind moderation of gamma rays and cloudiness (and therefore SSR). I haven’t heard anything since the last Kirkby et al CERN CLOUD report so nothing has changed from that to date as far as I know.
Sunspot numbers (SSNs) are a proxy for TSI so that’s the link in that regard – nothing to do with CERN CLOUD though.
>”Dr Jan Wright is completely out of touch with, or ignorant of, climate forcing. Anyone even remotely familiar with climate change issues knows that solar forcing is total solar irradiance (TSI) – not Milankovich cycles.”
CMIP5 – Modeling Info – Forcing Data [for AR5 report]
1. Recommended CMIP5 solar forcing data.
See SOLARIS website http://sparcsolaris.gfz-potsdam.de/cmip5.php
http://cmip-pcmdi.llnl.gov/cmip5/forcing.html
Recommendations for CMIP5 solar forcing data
This section provides links solar irradiance data that should be used in CMIP5 simulations. A description of how the data were reconstructed by Judith Lean can be found here, and some guidelines for their use are also provided. For some models, use of the spectrally-resolved data, which accounts for the wavelength dependent changes in solar irradiance, is unwarranted. For these models, the total irradiance time series should be used.
What to prescribe in the pre-industrial control simulation?
Use the TSI and/or spectrally resolved values for a mean representative of 1850 conditions, i.e. cycle average from year 1844 to 1856. Note that 1850 is a year near the peak of the solar cycle.
What to prescribe in the historic simulation (1850-2008)?
The whole time series (monthly values are available only after 1882).
What to prescribe in the future?
Repeat the last cycle (cycle 23), with values from 1996 to 2008 inclusive mapping to 2009-2021, 2022-2034 etc. Please note that cycle 23 starts in 04/1996 and ends in 06/2008. There have been some concerns that cycle 23 was unusually long and repeating this special cycle would give out of phase behavior of a normal 11-year solar cycle around 2050. Cycle 23 is actually only 12.2 years long not 13 years since it goes from 1996.4 to 2008.6. In Lean and Rind (2009, GRL, doi:2009GL038932) the irradiance was projected forward by just repeating cycle 23. Since it is unknown what the sun will do, there is going to be a lot of uncertainty for future solar irradiance projections. Also the two prior cycles (21 and 22) have been shorter than average – the official times of minima are 05/1976, 08/1986.8, 05/1996.4 and now 06/2008.6 so cycle 21 was only 10.3 years and cycle 22 was 9.6 years – which are not 11 years either! Cycles 21 and 22 have been some of the highest and shortest on record and its quite possible that cycle 23 may be more representative of the future – but of course nobody knows.
Spectrally resolved irradiance for CMIP5 models:
For models that can make sensible use of the spectrally-resolved irradiance, the following data should be used:
annual resolution TSI and spectrally resolved data from 1610 to 2000 and from 2000 to 2008
monthly resolved TSI and spectrally resolved data from 1882 to 2000 and from 2000 to 2008
Total solar irradiance for CMIP5 models:
For CMIP5 models with a poorly resolved stratosphere and models that are unable to make use of spectrally-resolved data, the following annual mean TSI time series provided by J. Lean should be used: TSI_WLS_ann_1610_2008.txt.
http://solarisheppa.geomar.de/cmip5
# # #
Not a word about “Milankovitch cycles”.
Note “Repeat the last cycle (cycle 23)” [TSI]. This means solar levels were held constant at SC 23 levels out to 2100. But already, after 2005 (before the specification above was written), solar levels within SC 23 had dropped 0.3 W.m-2 by 2009 and were known to be progressing downwards in SC 24 i.e. a constant SC 23 levels for the rest of this century is/was completely unrealistic.
See PMOD:http://www.woodfortrees.org/plot/pmod
AR5 cites Jones, Lockwood, and Stott (2012) who did a modeling study whereby 3 scenarios of reduced solar (below SC 23 levels) were investigated (all least-case – see below). Their results returned little change from sustained warming at constant solar levels in CMIP5/AR5.
This is a thermodynamic impossibility – a perpetuum mobile.
Reducing the level of energy input to a system cannot result in increased energy output unless the principles of thermodynamics (and physics in general) are overturned. Given Dr Jan Wright’s apparently huge knowledge gap in respect to energy input to the planetary sun => ocean(+ land) => atmosphere(+space) system, it is a very remote possibility that Dr Wright will be able to explain the IPCC’s thermal perpetuum mobile (not that anyone can of course).
BTW, Mike Lockwood (personal communication) dismisses Shapiro et al (2011) because “I have tried many times to understand their methodology and it just doesn’t make sense to me”. The solar progression since 1986 is right on track for Abdussamatov’s (2012) future prognosis which mirrors Shapiro et al’s historical estimate of 6 W.m-2 Maunder Minimum to 1986 and could be considered worst-case.
>”The IPCC estimates the observed warming from 1951 to 2010 (60 years) was approximately 0.6°C to 0.7°C. Then they claim that “more than half” of that increase was caused by our activities”
The IPCC anthropogenic attribution period: 1951 to 2010 (60 years).
Just to be clear. 1951 is the 7th year from the start of the graph of the 69 year 1945-2013 Wellington Harbour MSL series above in which no anthropogenic acceleration is evident.
From IPCC Ar5 SOD Chapter 13
http://www.ipcc.ch/pdf/assessment-report/ar5/wg1/drafts/WG1AR5_SOD_Ch13_All_Final.pdf
So the projections of SLR depend strongly on the theory that CO2 is heating the oceans, it would appear.
Oh, yes! It only remains to ask them to quantify that, please.
Note the difference between the mere expectation in chapter 10:
[Chapter 10] ““AIR-SEA FLUXES ARE THE PRIMARY MECHANISM BY WHICH THE OCEANS ARE EXPECTED TO RESPOND TO EXTERNALLY FORCED ANTHROPOGENIC AND NATURAL VOLCANIC INFLUENCES”
And the apparent, but unjustified, certainty in chapter 13:
[Chapter 13] “…..thus sea level rise from ocean warming is a central part of the Earth’s response to
increasing greenhouse gas concentrations”
[Chapter 13] “The largest increase in the storage of heat in the climate system over recent decades has been in the oceans”
OK, non contentious. But then the IPCC attribute both heat gain and sea level rise to CO2 “and thus sea level rise from ocean warming is a central part of the Earth’s response to increasing greenhouse gas concentrations”. This is highly contentious.
Highly contentious and a classic miss-attribution. The heat gain is attributable to changes occurring to the ocean heating agent, the sun:
Firstly, solar change from Maunder Minimum Grand Minimum (1600s) to Current Warm Period Grand Maximum (peak 1986 – non contentious). Estimates of the change vary from zero to 6 W,m-2 by Shapiro et al (2011) and just about anything in between – such is the science “settled” .
Secondly, sustained solar output at the highest level in the last 1000 years (possibly the last 11,000 years) from the late 1950s to the late 2000s.
There is a thermal time lag between change in energy input to ocean heat equilibrium, hence the lag from peak solar at 1986 to peak OHC from around 2003 onwards (fall from solar peak has only been about 0.3 W.m-2 by 2011). The simple analogy is water-pot-on-stave-element. Turn the element up and WAIT for the water to warm up.
>”So the projections of SLR depend strongly on the theory that CO2 is heating the oceans”
Yes, the thermosteric component. Problematic (to say the least).
Most recently the topic was brought up by Bob Tisdale who referred to RT’s CCG post and my ‘Anthropogenic Ocean Heating?’ series:
‘Arguments For and Against Human-Induced Ocean Warming’
wattsupwiththat.com/2014/12/09/arguments-for-and-against-human-induced-ocean-warming
The IPCC ‘imputes” heat to the ocean via climate sensitivity (CS) and the concept of Global Temperature change Potential (GTP) but by no as yet identified physical mechanism. See this comment (amended here):
richardcfromnz December 9, 2014 at 9:58 pm
Bob, re:
“AIR-SEA FLUXES ARE THE PRIMARY MECHANISM BY WHICH THE OCEANS ARE EXPECTED TO RESPOND TO EXTERNALLY FORCED ANTHROPOGENIC AND NATURAL VOLCANIC INFLUENCES”
This quote is from the Chapter 10 SOD leaked by Alec Rawls, and which was what I had access to at the time of writing [quote identified in Final in comment following this one and above Bob’s linked below]. You have to wade through the waffle to even get the slimmest grasp of what they are on about, viz,:
Final AR5 Chapter 10, Detection and Attribution of Climate Change: from Global to Regional:
http://www.ipcc.ch/pdf/assessment-report/ar5/wg1/WG1AR5_Chapter08_FINAL.pdf
Page 712 pdf :
8.7.1.3 The Global Temperature change Potential Concept
“By accounting for the climate sensitivity and the exchange of heat
between the atmosphere and the ocean, the GTP includes physical processes
that the GWP does not. The GTP accounts for the slow response
of the (deep) ocean, thereby prolonging the response to emissions
beyond what is controlled by the decay time of the atmospheric concentration.
Thus the GTP includes both the atmospheric adjustment
time scale of the component considered and the response time scale
of the climate system.”
But,
“The GTP values can be significantly
affected by assumptions about the climate sensitivity and heat uptake
by the ocean. Thus, the relative uncertainty ranges are wider for the
GTP compared to GWP (see Section 8.7.1.4). The additional uncertainty
is a typical trade-off when moving along the cause–effect chain to an
effect of greater societal relevance (Figure 8.27). The formulation of the
ocean response in the GTP has a substantial effect on the values; thus
its characterization also represents a trade-off between simplicity and
accuracy.”
Firstly, in their narrative there is only an implicit link between CS and ocean heat but on which they don’t elaborate (no science or citation). Even so they are simply stating “exchange of heat between the atmosphere and the ocean”. That is not an insulation effect because the inference is that if there is anthropogenic forcing of ocean heat it is simply an air-to-sea energy transfer (problematic even for the IPCC – see Chapter 3 below).
Secondly, their implicit CS-ocean heating link is only based on their “assumptions” anyway.
Chapter 3, is more explicit on page 274 pdf:
Observations: Ocean
http://www.ipcc.ch/pdf/assessment-report/ar5/wg1/WG1AR5_Chapter03_FINAL.pdf
3.4 Changes in Ocean Surface Fluxes
3.4.1 Introduction
“The net air–sea heat flux is the sum of two turbulent (latent and sensible)
and two radiative (shortwave and longwave) components. Ocean
heat gain from the atmosphere is defined to be positive according to
the sign convention employed here.”
Except ocean heat gain is by the heating agent – solar shortwave radiation (DSR) change modulated by cloudiness change – not the atmosphere. Downwelling longwave radiation (DLR) is not the ocean heating agent. DLR enhances evaporation which is the major oceanic heat loss mechanism (i.e. a cooling effect). The IPCC makes the respective major gains and losses clear – solar gain, evaporative loss:
3.4.2 Air–Sea Heat Fluxes
3.4.2.1 Turbulent Heat Fluxes and Evaporation
“The latent and sensible heat fluxes have a strong regional dependence,
with typical values varying in the annual mean from close to zero to
–220 W m–2 and –70 W m–2 respectively over strong heat loss sites”
3.4.2.2 Surface Fluxes of Shortwave and Longwave Radiation
“The surface shortwave flux has a strong latitudinal dependence with
typical annual mean values of 250 W m–2 in the tropics. The annual mean
surface net longwave flux ranges from –30 to –70 W m–2.”
This is all conventional and non-contentious. The problem(s) for the IPCC is that it is impossible to detect a net air-sea flux change – let alone a net air-to-sea flux (an anthropogenic fingerprint):
3.4.6 Conclusions
“Uncertainties in air–sea heat flux data sets are too large to allow detection
of the change in global mean net air–sea heat flux, on the order
of 0.5 W m–2 since 1971, required for consistency with the observed
ocean heat content increase. The accuracy of reanalysis and satellite
observation based freshwater flux products is limited by changing data
sources. Consequently, the products cannot yet be reliably used to
directly identify trends in the regional or global distribution of evaporation
or precipitation over the oceans on the time scale of the observed
salinity changes since 1950.”
# # #
In other words, as I interpret, simply a long-winded way of saying – no anthropogenic ocean heating signal detected.
Bob Tisdale December 10, 2014 at 12:55 pm
richardcfromnz says: “In other words, as I interpret, simply a long-winded way of saying – no anthropogenic ocean heating signal detected.”
Bravo for finding that. I’ll have to take a closer look. Thanks.
Cheers.
http://wattsupwiththat.com/2014/12/09/arguments-for-and-against-human-induced-ocean-warming/#comment-1811014
I have a suspicion that a particular language mode is used by ‘science advisers’ when writing reports for ministers. The mode leans heavily on in-house science jargon which the poorly-educated ministers do not understand, spiced with scary scenarios and sprinkled heavily with plain old agricultural-grade bullshit. When delivered in very serious presentations, this has the power to both dazzle and frighten most politicians who, when it comes to figuring out how stuff actually works, are absolutely out of their depth.
I had experience in the UK of members of the lower House being apalled that half the school children in the UK’s Primary system were below the UK average on every educational measure: I suspect Brit MPs are no better educated than ours, either.
If this stuff wasn’t sad and so important, it would make a really wonderful comedy script.
The report to me reveals a very low level of understanding of the issues around climate science, rather than any clever weasel words that Bob Ward (for example) might come up with
Andy, the level of understanding of Climate Science demonstrated in this report is so low that I would pitch it at about Yr 10 or 11 for a fair-to-middling student. My point about language modes is borne out by the reasonably eloquent English used throughout, but the science and the reasoning are grossly inferior to what should be expected to be produced by a Science Advisor to government.
The paper’s strength is in cleaving closely to the official UN AGW doctrine but the actual science is a fail.
Coastal Ratepayers United (CRU) – Kapiti Coast District Council
http://coastalratepayersunited.co.nz/index.html
Yes, unfortunate acronym, i know.
Latest News
Independent Review of the Coastal Erosion Hazard Assessment
Click here to read the Independent Review of the Coastal Erosion Hazard Assessment. Coastal_Erosion_Hazard_Assessment_Review_of_the_science_and_assessments_undertaken_for_the_PDP (PDF)
Coastal Erosion Hazard Assessment for the Kāpiti Coast:
Review of the Science and Assessments Undertaken for the Proposed Kāpiti Coast District Plan 2012
http://www.coastalratepayersunited.co.nz/latest-news/wp-content/uploads/Coastal_Erosion_Hazard_Assessment_Review_of_the_science_and_assessments_undertaken_for_the_PDP.pdf
2.1 Rising Sea Levels: Rates and Future Projections [page 15]
Figure 1: Global mean sea levels from 1800 to the present, and projected to 2100.
Figure 2: Analysis of the Wellington tide-guage measurements from 1900 to 2010.
# # #
I’ve contacted CRU via their “Contact us” page referring them to this post.
Note to CRU members: “CRU” is also an acronym for the UKMO’s Hadley Climate Research Unit heavily implicated in skulduggery by the Climategate emails, hence “unfortunate acronym” above.
Page 17 ‘Coastal Erosion Hazard Assessment for the Kāpiti Coast’:
……………………………………….in Figure 2 from their study, the linear regression spanning the
century up to 2010 showing a trend of 2.30 ± 0.15 mm/year. With this long-term rate of rise in
the relative mean sea level being greater than the global average rate (Figure 1), the indication
is that this coast has experienced subsidence, of the order of 0.3 mm/year.
Subsidence along this coast is expected from the Pacific and Australian plates being “locked” on their subduction interface, storing tectonic energy, not having been released by occurrences of major subduction earthquakes during historic times.
Subsidence of this shore and all along the east coast of the
North Island is also demonstrated by GPS units that have measured land-elevation changes for
about a decade (Beavan and Litchfield, 2009). As analysed by Bell and Hannah (2012), a GPS
unit located near the Wellington tide gauge shows a subsidence rate of about 1.7 mm/year since
2000, a localised higher rate of subsidence of the land that is attributed to “slow-slip” tectonic
movements on the subduction interface, a gradual slip that does not generate a strong
earthquake, having been identified by seismologists (Wallace and Beavan, 2010).
Similar GPS measurements on the Kāpiti Coast show a smaller subsidence rate of 1 mm/year
Page 18 ‘Coastal Erosion Hazard Assessment for the Kāpiti Coast’:
The panel recommends [climate] model result scenarios – mid range Figure 2..
Not sure if this has been implemented in the Kapiti Coast District Plan. Very foolish if so.
‘Climate Models vs Argo Data (Reality)’
Global Ocean Temperatures, 0 – 700m
http://jonova.s3.amazonaws.com/graphs/ocean/global-ocean-temperature-700m-models-argo.gif
Too hot.
RC,
That is an excellent question. It needs to be asked continually, for the pea keeps appearing under a different shell. I shall for ever detest the founders of the UNFCCC and IPCC (which one was it?) for their blatantly misleading definition of climate change.
By the way, I’m going to start referring to the IPCC as the United Nations, because the IPCC is merely a leading lap-dog agent for the advancement of the UN megalomaniacs’ agenda. While I’m on the subject, how long do you think it’ll be before Helen Clark is its Secretary-General?
>”how long do you think it’ll be before Helen Clark is its Secretary-General?”
Don’t know when Ban Ki-moon’s tenure ends (can’t come soon enough).
Helen Clark definitely a possibility, but then, so is Barack Obama. He was after all a “community organizer”, a communitarian, and still is. Although there’s probably a few countries that would veto that appointment. Helen Clark would have the edge in that case.
I don’t think there’s hope for improvement whoever it is unfortunately. Not all bad in the past amid the criticisms of course:
Former secretaries-general http://www.un.org/sg/formersgs.shtml
But criticisms there are:
Claudia Rossett: The UN Is Absolutely Corrupt
http://www.newenglishreview.org/Jerry_Gordon/Claudia_Rossett%3A__The_UN_Is_Absolutely_Corrupt/
Covers in brief:
# Why the U.N. Structure abets Corruption.
# The U.N. Iraqi Oil for Food scandal
# The UN Development Program and “Cash for Kim Jong Il,”
# The UNRWA program for Palestinian Refugees – The Hamas Enabler
# The ‘new’ UN Human Rights Commission (see reference to Mark Steyn)
FCCC Green Climate Fund and Adaption Fund seem to the UN cash cows that the megalomaniacs only dreamed about above – if only the billions would just pour in.
>”Don’t know when Ban Ki-moon’s tenure ends (can’t come soon enough).”
Term length: 5 years renewable (traditionally limited to 2 terms)
http://en.wikipedia.org/wiki/Secretary-General_of_the_United_Nations
“The current Secretary-General is Ban Ki-moon of South Korea, who took office on 1 January 2007. His first term expired on 31 December 2011. He was re-elected, unopposed, to a second term on 21 June 2011.”
Term ends June 2016 then.
Deputy: Jan Eliasson, DSG
http://en.wikipedia.org/wiki/Jan_Eliasson
RC,
No. Are you just making things difficult by changing the ground rules? 😉 I meant a link with TSI (total solar irradiance). I had never heard of SSR (solar surface radiance) before now, which anyway sounds a lot like TSI. What’s the difference?
>”I had never heard of SSR (solar surface radiance) before now, which anyway sounds a lot like TSI. What’s the difference?”
TSI is the total radiance (UV-Vis-IR) received by the earth at the top of atmosphere (TOA). Termed the solar “constant” because it was thought that the level remained constantly average across a long sequence of 11 yr cycles. Not so, there is a variation that has been realized in the satellite era that is measurable e.g. the end of SC 23 was about 0.3 W.m-2 less than the end of SC 22.
So now the huge uncertainty arises: what was the TSI variation Maunder Minimum to 1986 Maximum? It could have been as much as 6 W.m-2 (Shapiro et al). And if there was a large historical variation it follows that a large future variation is possible too. Hence the wide range of prediction scenarios.
SSR is exactly the same radiation as TSI (same UV-Vis-IR spectrum) except the SSR variation is far greater than TSI because of cloudiness changes. Cloud tops reflect some incoming irradiance straight back out to space (about 25%), less reflective clouds re-direct the rays i.e. creating a “diffuser” effect. Hence the term for solar radiation received at the surface via clouds is known as “diffuse” SSR. Not as intense as clear-sky SSR and not direct either. Total SSR therefore is a combination of clear-sky and all-sky (includes diffuse) irradiance that reaches the surface.
So a change in cloudiness levels has a significant influence on SSR. This is why it is so important to know the driver of cloudiness levels. Climate models still do not have cloud-resolving functions that adequately model clouds, let alone changes in cloudiness because the driver is not known.
Aerosols have a similar effect except the particles are solar ray blockers (not a real term – I made that up) rather than diffusers. The total result is the solar radiation absorption and reflectivity of the earth known as albedo (reflection coefficient 0.29 – 0.37):
http://hyperphysics.phy-astr.gsu.edu/hbase/phyopt/albedo.html
>”The total result is the solar radiation absorption and reflectivity of the earth known as albedo”
Regional variations in cloudiness and aerosols is the “dimming” and “brightening” phenomenon:
http://en.wikipedia.org/wiki/Global_dimming
The Earthshine Project accurately determines the earth’s albedo:
‘The Earthshine Project: update on photometric and spectroscopic measurements’
http://bbso.njit.edu/Research/EarthShine/literature/Palle_etal_2004_ASR.pdf
SSR is at the bottom of all of this – literally. TSI is at the top.
Ah, I see now. So: TSI at the top, SSR at the surface; nicely alliterative. A generous exposition, too, easy to understand. Thank you for taking the trouble.
Has Increased Sunshine Caused UK Warming In The Late 20th Century?
Paul Homewood / December 23, 2014
Now the jigsaw began to fit into place. The increase in sunshine hours, particularly during winter, was not caused by changing weather patterns but a reduction in air pollution. It is not unreasonable, then, to surmise that this increase in sunshine was, at least in part, responsible for the increase in temperatures we have seen. As the graph below shows, there is pretty good correlation between sunshine and temperature.
http://notalotofpeopleknowthat.files.wordpress.com/2014/12/image_thumb78.png?w=900&h=450
There is nothing very new in this argument, as air pollution has often been quoted as the reason for the decline in northern hemisphere temperatures during the 1960’s and 70’s. However, that logic misses the point that pollution has been a major factor since the mid 19thC. If it is true that a polluted atmosphere can depress temperatures, then these temperatures have been lower as a result for a century or more.
With a cleaner atmosphere now, temperatures have simply returned to the level they would have been at in the past. This phenomenon of a sharp rise in late 20thC temperatures is not limited to Britain. We see the same effect across much of NW Europe, for instance France and Germany, as GISS show:…….>>>>>
http://notalotofpeopleknowthat.wordpress.com/2014/12/21/has-increased-sunshine-caused-uk-warming-in-late-20thc/
http://wattsupwiththat.com/2014/12/23/has-increased-sunshine-caused-uk-warming-in-the-late-20th-century/
SSR again.
The report makes a lot more sense if you replace the opening sentence
with
>”…in 1979 sitting in a lecture theatre at the University of California, Berkeley…”
Her understanding of the details doesn’t appear to have progressed much in the intervening 35 years.
But I suppose that passage adds the degree of cred she is seeking from the reader. As in Wow! Way back in ’79! In a University lecture!. In California! Berkeley no less!
And sitting too!
Never mind that long before that NZ farmers had experienced the vagueries of climate and “extreme’ weather – prolonged droughts, heat, floods, storms, cold, hail, snow, whatever. And rescuing live stock or disposing of dead stock doesn’t involve much sitting. And stock losses and loss of production costs plenty in any year and especially a succession of years.
I don’t think Dr Wright would get much traction among those crusty old farmers with her “sitting in a lecture theatre” lead in.
The PDO wasn’t named until the 1990s. Funny how everyone head about “climate change” in the late 70s.
Summer of Love?
Just hearing about stuff does not necessarily make anyone an expert. Case-in-point Dr Jan Wright.
But hearing certain stuff can be lucrative if passing on what has been heard conveys an impression of expertise and credibility, even if unwarranted. Case-in-point Dr Jan Wright.
Climate change has been a leverage for these people, an adjunct that has propelled them to higher status and commensurately rewarding heights financially. But the basis of it all is falling apart around their ears.
I’ve been wondering lately about the structures and personal built around the conjecture when it comes crashing down. The supercomputer facilities, the govt departments, the Universities, the UNFCCC, the Dave Frames, the Jan Wrights. Those and they only have about 5 years of this left. Jan Wright must be near retirement but there’s masses of younger people and dollops of capital tied up in this mess.
The dismantling of it all will not be pretty.
I think part of the problem is that the groupthink that has excluded all criticism from the subject has led to the dumbing down of the subject area to the point where the people making the big decisions appear to be mentally retarded.
Yes and too many people just going along with it and not calling them out. Meteorologists for a start. They have a qualification that to me is the fundamental basis of climatology and should provide them with critiquing ability at the level needed for starters. But what is a climatologist’s qualification?
Sure there are climatologists with meteorology quals but how many and who are they?
Dave Frame for example has these qualifications: PhD in Physics; Bachelor’s degree in Philosophy and Physics from the University of Canterbury, in New Zealand
Dave’s physics should enable him to pull AGW apart at the seams – but he doesn’t. He has a vested interest in it so no way is he going to rock the boat.
Given global warming is essentially about heat, radiative heat transfer, and thermodynamics then physics is the requisite education. I suppose meteorology covers the fundamentals (i don’t know) but without this fundamental knowledge these people (e.g. Jan Wright) are not experts. And those with the education are AWOL (e.g. Dave Frame).
We get preached to by too many people who are simply not experts on the subject. And not enough people with the required expertise or transferable expertise are asking the right questions or calling bogus.
Some of the stuff is basic common sense
When Greenpeace tell us that we can power the entire world with renewables, that apparently do not require any fossil fuels for manufacture or backup, a lot of people believe them
I have a former work colleague who believes that the entire world is able to be powered by solar PV, fed by organic food without fertilizers or GMO, and thinks that Russell Brand is a voice worth listening too
He recently “defriended” me on Facebook after one too many of my common sense interjections (describing me as an obnoxious troll – get a pattern here?) , and he has a technical job and a degree in computer science.
I give up, sometimes
>”But what is a climatologist’s qualification?”
Applied Meteorology and Climatology MSc
Duration: 1 year full-time for MSc (Postgraduate Diploma, Graduate Diploma, Postgraduate Certificate, PGDip, PGCert.
Details
The programme was initiated in 1963 and developed in response to industry and research institution requirements for applied meteorologists and climatologists. This demand continues, partially due to the growing attention of the society to climate change, its mitigation and adaptation to it.
Skills gained
The programme aims to:
# Provide training in theoretical and applied aspects of atmospheric physics and dynamics, quantitative modelling techniques, weather forecasting, climate prediction and observation of atmospheric processes
# Equip you with the skills of quantitative and statistical analysis with regards to atmospheric data processing and management
# Enable you to apply theoretical concepts and analytical techniques to the resolution of environmental and socio-economic problems that have an atmospheric origin
# Develop your independent research ability
# Convert participants with non-environmental backgrounds to applied meteorologists and climatologists
# Develop your communication skills using traditional and IT-based media
http://www.birmingham.ac.uk/postgraduate/courses/taught/gees/applied-met-climatology.aspx#CourseDetailsTab
Jim Hickey’s replacement Dan Corbett seems to tick all the boxes. On TV news last night he said he had “noticed” the weather had become more erratic in recent years
Rock solid science Dan.
Applied Meteorology and Climatology MSc
Modules
The course is modular in nature, comprising 180 credits, 120 from MSc-dedicated taught modules and 60 from a dissertation. In line with University Regulations it is intended that 60 credits be the equivalent of a Certificate, 120 credits a Diploma and 180 credits the MSc. All taught courses are compulsory for non-maths and physics graduates.
The course structure is:
Stage 1: PGCert (a total of 60 credits out of the 80 credit modules)
Module M1a: Theoretical Meteorology: Atmospheric Composition and Physics
Module M2: Weather Forecasting and Climate Modelling
Module M3: Atmospheric Data Processing and Statistics
Module M5: Physical Climatology and Climate Change
Module M10: Meteorological Applications and Services
Stage 2: PGDip (a total of 120 credits)
Module M1b: Theoretical Meteoroloy: Atmospheric Dynamics
Module M4: Mathematics
Module M7: Weather, Climate and Society (optional to M4)
Module M8: Applied Micrometeorology (optional to M4)
M9 Atmospheric Observation
M11 Air Pollution Chemistry (optional to M9)
M12 Causes and Effects of Air Pollutants (optional to M9)
M13 Carbon Cycle and Carbon Management
Stage 3: MSc (a total of 180 credits)
Research components:
M6a Research Proposal for Dissertation
M6b Dissertation
http://www.birmingham.ac.uk/postgraduate/courses/taught/gees/applied-met-climatology.aspx#CourseDetailsTab
Module M1a: Theoretical Meteorology: Atmospheric Composition and Physics
M1a provides students with theoretical training in the fundamental laws of thermodynamics, microphysics and radiation and their implications for a range of meteorological processes and air pollution phenomena, coupled with an introduction to the controls on atmospheric composition. Specifics include: (1) to review the basic nature of the atmosphere in terms of its physical properties; (2) to introduce mass balance modelling of atmospheric composition and its time evolution; (3) to introduce a range of physical laws relevant to meteorology such as the first and second laws of thermodynamics and the equation of state; (4) to review cloud microphysics and cloud formation processes; and (5) to introduce basic radiation laws and radiative transfer processes in the atmosphere.
This module is assessed by three practical exercises (40%) and a two-hour exam (60%). For each of the three practical exercises, a one-hour tutorial class is provided to help students to further understand concepts and processes and to develop analytical and problem-solving skills.
[OK so far – the fundamentals I’m looking for]
Module M5: Physical Climatology and Climate Change
The understanding of the variability of the climate system and its inherent changes in time will be a major component to address any questions of natural and anthropogenic climate change. This module will help students to become familiar with the underlying physical concepts as well as with its applications to attribute and detect anthropogenic climate change. The module will cover the basic physical laws, their application in the climate system, basics of the observed atmosphere and ocean general circulation, its 3-dimensional features, and will focus on main modes of large scale variability (e.g. NAO, PNA, ENSO, etc). The variability on different time scales will be addressed as well as anthropogenic climate change including an impact assessment and an introduction into actual political and social processes related to it.
The module will be assessed by a written exam (50%) and a combined student presentation and essay (50%).
[AGW is hard-wired into their brains]
What happened to # Develop your independent research ability ?
Good example, I saw him in that clip and made sure I retrieved the transcript upthread for the record. Dan Corbett should know better and elucidate the issues at a level several notches above what he’s noticed.
His background though, explains a few things (from Wikipedia):
“Daniel Corbett is a British broadcast meteorologist, who worked for the Met Office and the BBC for many years until May 2011. He first joined the Met Office and BBC Weather Centre in 1997, after beginning his career in the United States. In May 2011, Corbett made his final BBC weather report prior to taking up a new post in New Zealand with the MetService.”
http://en.wikipedia.org/wiki/Daniel_Corbett
No doubt some indoctrination sessions were mandatory at the Met Office and BBC. Now we get to share. Great.
My quest now will be to find a MSc in Applied Meteorology and Climatology who can explain to me how an enhanced greenhouse effect can produce more energy from the planetary climate system at lower levels of energy input than at higher levels of energy input as cited in IPCC AR5 Chapter 8, Jones Lockwood, and Stott (2012).
The explanation will have to be in terms of the “range of physical laws relevant to meteorology such as the first and second laws of thermodynamics” taught and examined in the MSc qualification (M1a: Theoretical Meteorology: Atmospheric Composition and Physics above).
The explanation, I presume, will include solid reasons why said physical laws are overturned in the man-made climate change or anthropogenic global warming conjecture.
Should be interesting. I’m looking forward to that.
Jim Hickey is a pilot and has a diploma in meteorology.
Karen Olsen is a “qualified meteorologist” but at what level I can’t identify.
“TVNZ weather expert Karen Olsen lived on Raoul Island for 13 months over 20 years ago and I spoke to her about her time on the island. Karen worked for MetService and was based there to provide information to Wellington on current conditions and the island acted as an early warning station for any storms that may be moving south towards New Zealand.”
http://www.weatherwatch.co.nz/content/karen-olsen-my-time-living-raoul-island
I always get the impression she knows what she is talking about.
[Andy] – “I think part of the problem is that the groupthink……”
[Me] – “Yes and too many people just going along with it and not calling them out. Meteorologists for a start. They have a qualification that to me is the fundamental basis of climatology and should provide them with critiquing ability at the level needed for starters.”
Here’s one meteorologist calling out the groupthink:
‘The inculcation of final-form climate science’
Written by Anthony J. Sadar, American Thinker on 22 December 2014.
With the close of another college semester, the long holiday break can give educators a chance to ponder the dismal state of science literacy in the U.S. The sad decline in robust science education is certainly part of the problem and is perhaps most obvious in environmental science classrooms. Contributing to the issue is the skewed content in many college textbooks on the environment and ecology.
While a part-time college professor of the physical, environmental, and atmospheric sciences since 1986 and a practitioner in the field since the late 1970s, I have had the opportunity to review and use numerous popular textbooks.
I was disappointed to read in one of the latest textbooks – Essential Environment: The Science Behind the Stories, 5th edition (2015) by Jay Withgott and Matthew Laposata [see book cover at link below] – the following distorted statement about those of us who dare to challenge the current groupthink on climate change.
“Public debate over climate change has been fanned by corporate interests, spokespeople from think tanks, and a handful of scientists funded by fossil fuel industries, all of whom have aimed to cast doubt on the scientific consensus.” (p. 322)
This typical misrepresentation is found within Chapter 14 of the book, titled “Global Climate Change.” The subsection of the chapter is labeled “Are we responsible for climate change?” and contains a mere six long sentences crafted to convince students that there are no real honest skeptics to the “consensus” view.
In truth, there are many of us who honestly represent no corporate interests, are not involved with think-tanks, and have no connection to fossil fuel industries (except to enjoy the comfortable benefits afforded by modern energy sources).
In my discussions with numerous environmental professionals, nearly all have expressed some doubt (most much doubt) that humans are largely responsible for long-term global climate change. Yet textbook authors continue to push the idea on vulnerable students that the matter is an open-and-shut case.
A 2012 poll conducted by the George Mason University Center for Climate Change Communication quizzing members of the American Meteorological Society (including me) about confidence that we humans are causing climate change revealed that the so-called consensus claim is quite dubious. Setting aside the fact that consensus-building is the bailiwick of politicians, not scientists, and even assuming the existence of substantial anthropogenic global warming, no more than 40% of AMS respondents to the George Mason questionnaire claimed that such global warming is dangerous. The survey results further challenge the official proclamation of the AMS that asserts that humans are largely responsible for climate change.
Several years ago, when I was a student in a doctoral science education program, we were rightly instructed to shun “final-form science” – that is, scientific conclusions that claim to be established beyond any reasonable doubt and are dictated to students as absolute truth. Nevertheless, the dogmatic climate-change statements of “consensus” and “settled” science being inculcated in unsuspecting undergraduate students are exactly that – readily challengeable and practically challenged science portrayed as established, indisputable fact. By practically challenged science, I refer to the greater than 15-year “hiatus” in global warming that has been confounding the hypothesis of human greenhouse gas impact on global temperatures.
In addition, practically challenged includes the objective observations and perspective of real-world field professionals who experience and research a complex climate system that is far from explicable by subjective academic climate models.
Scientific literacy will be better promoted by textbook authors providing a broader – and thus more accurate – perspective on critical contemporary issues such as global climate change. Any book that claims to tell the story of science behind the headlines yet obfuscates how real-world science operates does a disservice to both students and society.
Anthony J. Sadar, a certified consulting meteorologist, is author of In Global Warming We Trust: A Heretic’s Guide to Climate Science (Telescope Books, 2012).
http://www.climatechangedispatch.com/the-inculcation-of-final-form-climate-science.html
[RT, any chance you might re-blog this?]
Functions and powers (of the Parliamentary Commissioner for the Environment)
Functions
These functions are drawn from the Environment Act 1986 (S.16), and the Commissioner has wide discretion to exercise them. They include:
•Review the system of agencies and processes set up by the Government to manage the country’s resources, and report to the House of Representatives
•Investigate the effectiveness of environmental planning and management by public authorities, and advise them on remedial action
•Investigate any matter where the environment may be or has been adversely affected, advise on preventative measures or remedial action, and report to the House
•Report, on a request from the House or any select committee, on any petition, Bill, or any other matter which may have a significant effect on the environment
•Inquire, on the direction of the House, into any matter that has had or may have a substantial and damaging effect on the environment
•Undertake and encourage the collection and dissemination of information about the environment
•Encourage preventive measures and remedial actions to protect the environment.
Powers
The Commissioner has wide powers to investigate and report on any matter where, in her opinion, the environment may be, or has been, adversely affected. Parliament or any parliamentary select committee may also ask her to report on environmental matters.
The Environment Act 1986 outlines her functions and provides for powers including:
•obtaining information
•summoning people and examining them under oath
•protecting sources of information and maintaining confidentiality
•employing staff and consultants.
The Commissioner also has wide powers to report findings and make recommendations. However, she does not have the power to make any binding rulings and nor can she reverse decisions made by public authorities.
The acceptance and effectiveness of the PCE’s advice depends to a large degree on the independence, integrity, and quality of the investigations undertaken by the office.
Functions and powers
Functions
These functions are drawn from the Environment Act 1986 (S.16), and the Commissioner has wide discretion to exercise them. They include:
•Review the system of agencies and processes set up by the Government to manage the country’s resources, and report to the House of Representatives
•Investigate the effectiveness of environmental planning and management by public authorities, and advise them on remedial action
•Investigate any matter where the environment may be or has been adversely affected, advise on preventative measures or remedial action, and report to the House
•Report, on a request from the House or any select committee, on any petition, Bill, or any other matter which may have a significant effect on the environment
•Inquire, on the direction of the House, into any matter that has had or may have a substantial and damaging effect on the environment
•Undertake and encourage the collection and dissemination of information about the environment
•Encourage preventive measures and remedial actions to protect the environment.
Powers
The Commissioner has wide powers to investigate and report on any matter where, in her opinion, the environment may be, or has been, adversely affected. Parliament or any parliamentary select committee may also ask her to report on environmental matters.
The Environment Act 1986 outlines her functions and provides for powers including:
•obtaining information
•summoning people and examining them under oath
•protecting sources of information and maintaining confidentiality
•employing staff and consultants.
The Commissioner also has wide powers to report findings and make recommendations. However, she does not have the power to make any binding rulings and nor can she reverse decisions made by public authorities.
The acceptance and effectiveness of the PCE’s advice depends to a large degree on the independence, integrity, and quality of the investigations undertaken by the office.
“The acceptance and effectiveness of the PCE’s advice depends to a large degree on the independence, integrity, and quality of the investigations undertaken by the office”
The Commissioner has done herself no credit with this report. She will surely look back on this in a few years and ask herself why she was sucked in.
The degradation of science by the ‘consensus’ meme is disgraceful but, on its own, would be sorted out by the usual scientific squabbling – of the Wegener tectonic plates type of process – unseemly but effective in the longer term. The climate thing though is different in that an enormous amount of money has become involved and when the thing finally falls apart we will see that great damage has been caused:
• The reputation of ‘science’ as a discipline we can rely on for impartial advice will have been diminished.
• Truly vast amounts of taxpayer funds will have been spent to no effect but the enriching of many already wealthy individuals.
• Environmentalism as a worthy movement will have been seriously discredited.
I and, I suspect, most people, do not like being treated as an idiot or being told how to think and what to do. The backlash is likely to be severe therefore and I wonder if there is any sort of ‘soft landing’ option for this thing? In this connection I was interested to read on the Bishop Hill blog of a meeting in Bristol a month or so ago when some very well known alarmists and sceptics managed to have dinner together and a somewhat helpful meeting of minds.
Hi Stuart. An interesting analysis I tend to agree with. That meeting was hosted at the home of independent climate scientist Nicholas Lewis. It was reported at Bishop Hill, as you say, at WUWT (Anthony Watts was a guest) and at greater length by Sophie Yeo at Responding to Climate Change. It arouses strong hope for an outbreak of moderation that could transform the climate wars. In the NZ Climate Science Coalition which I belong to considerable distaste is expressed at the bad blood between the two poles of the climate ‘debate’ and many members are making a conscious effort to remove rancour and ill will from their own contributions, accidental or deliberate, in writing and in speech. I have some way to go.
Wright is right, the rate of sea level rise is increasing:
http://www.realclimate.org/index.php/archives/2015/01/a-new-sea-level-curve/
That’s a nice little sine wave looking curve in that first derivative graph they draw.
They achieved that result by adjusting the pre 1990 sea level rise data down in order to get a steeper incline so the data matches the models. The same tactic used with the surface temperature records to make it look like it’s been warming faster than it really has:
“We expected that we would estimate the individual contributions, and that their sum would get us back to the 1.5 to 1.8 mm per year that other people had predicted,” Hay said. “But the math doesn’t work out that way. Unfortunately, our new lower rate of sea-level rise prior to 1990 means that the sea-level acceleration that resulted in higher rates over the last 20 years is really much larger than anyone thought.”
http://wattsupwiththat.com/2015/01/14/claim-acceleration-in-sea-level-rise-worse-than-we-thought/
Nothing a bit of data massaging won’t fix.
>”Wright is right, the rate of sea level rise is increasing:”
Simon, try thinking your comments through for a change before you make them. Wright is way out of the ball park i.e. in no way can her prognosis be described as “right”..
Jan Wright would have everyone believe by her inept report that SLR in the order of 85.7mm/decade is to be expected from now until 2050 around New Zealand. That’s 8.57mm/yr, say 8.6.
Except this is highly problematic given your link to the RC Hay et al (2014) article and the current Wellington Harbour SLR graphed in the post which is an example but not necessarily typical of New Zealand. Take a look at RC Figure 2 first derivative that Andy refers to:
Fig 2 Rates of sea-level rise calculated from the curves in Fig. 1. To calculate the rate of increase, sea level curves were first smoothed with a filter of half-width 15 years and then differentiated.
http://www.realclimate.org/images//haysl21.jpg
2.5mm/yr Wellington Harbour
2.2mm/yr Hay et al 1940 Fig 2
0.5mm/yr Hay et al 1960 Fig 2
2.7mm/yr Hay et al 2000 Fig 2
Wright’s implied 8.6mm/yr looks ridiculously out of place in that lot so OK let’s look at the highest estimate:
3.4mm/yr Jevrejeva et al 1950 Fig 2
0.8mm/yr Jevrejeva et al 1975 Fig 2
3.7mm/yr Jevrejeva et al 2000 Fig 2
Wright’s implied 8.6mm/yr still looks ridiculously out of place doesn’t it Simon? How then can Wright possibly be “right”?
[Real Climate – Stefan Rahmstorf] – “Previous estimates had placed sea-level rise at between 1.5 and 1.8 millimeters annually over the 20th century. Hay and Morrow, however, suggest that from 1901 until 1990, the figure was closer to 1.2 millimeters per year. But everyone agrees that global sea level has risen by about 3 millimeters annually since that time, and so the new study points to a larger acceleration in global sea level.”
Except Rahmstorf’s own Figure 2 demonstrates cyclicity as Andy points out. The IPCC’s anthro attribution period is 1951 – 2010. Every Fig 2 estimate except Wenzel & Shroter exhibits a pronounced deceleration from 1950 to 1960/75. That is not “consistent” with anthropogenic forcing.
And given all the curves look to be starting to change phase after 2000, Wright’s prognosis is even more unlikely.
‘Sea level rise was less than thought (skeptics were right)’
http://joannenova.com.au/2015/01/sea-level-rise-was-less-than-thought-skeptics-were-right/
The BBC have something on the new paper on SLR
http://www.bbc.com/news/science-environment-30816143
as does the Bishop
http://www.bishop-hill.net/blog/2015/1/15/whats-up-with-this.html
New term: “probabilistic estimates”
No mention anywhere (except sceptic blogs) of the deceleration in the satellite data:
‘New paper shows global sea level rise has greatly decelerated since ~2002, opposite of [climate model] predictions’
Ocean Sci. Discuss., 11, 2029-2071, 2014
http://www.ocean-sci-discuss.net/11/2029/2014/
doi:10.5194/osd-11-2029-2014
Improved sea level record over the satellite altimetry era (1993–2010) from the Climate Change Initiative Project
M. Ablain1, A. Cazenave2, G. Larnicol1, M. Balmaseda11, P. Cipollini7, Y. Faugère1, M. J. Fernandes10,14, O. Henry2, J. A. Johannessen3, P. Knudsen6, O. Andersen6, J. Legeais1, B. Meyssignac2, M. Picot12, M. Roca8, S. Rudenko9, M. G. Scharffenberg4, D. Stammer4, G. Timms5, and J. Benveniste13
1Collecte Localisation Satellite(CLS), Ramoville Saint-Agne, France
2Laboratoire d’Etudes en Géophysique et Océanographie Spatiales (LEGOS), Toulouse, France
3Nansen Environmental and Remote Sensing Center (NERSC), Bergen, Norway
4University of Hamburg, Hamburg, Germany
5CGI, London, UK
6Technical University of Denmark (DTU), Lyngby, Denmark
7National Oceanography Centre (NOC), Southampton, UK
8isardSAT, Barcelona, Catalunya, Spain
9Helmholtz Centre Potsdam GFZ German Research Centre for Geosciences, Telegrafenberg, 14473 Potsdam, Germany
10Faculdade de Ciências, Universidade do Porto, 4169-007 Porto, Portugal
11European Centre for Medium-Range Weather Forecasts (ECMWF), Reading, UK
12Centre National d’Etudes Spatiales (CNES), Toulouse, France
13European Space Agancy (ESA), ESRIN, Frascati, Italy
14Centro Interdisciplinar de Investigação Marinha e Ambiental (CIIMAR/CIMAR), Universidade do Porto, 4050-123 Porto, Portugal
http://hockeyschtick.blogspot.co.nz/2014/10/new-paper-shows-global-sea-level-rise.html