

Richard Cumming takes a look at recent observational data on two topics often raised and guaranteed to cause concern. They are used both to “prove” the existence of rapid warming and as an example of the ills soon to befall us if we don’t prevent them. But both uses fail on a cool examination of the facts. The Climate Conversation Group calls for calm to prevent public hysteria.
Recent global mean sea level and ocean heat content trends
“The sea level continues to rise” is a familiar refrain, but the AGW hypothesis, along with the IPCC AR4, both predict an accelerating rate of rise in the global mean sea level. The IPCC prediction is simply:
“Anthropogenic forcing is also expected to produce an accelerating rate of sea level rise.”
That sea levels are rising is undisputed, but what are the recent trends of both mean sea level (MSL) and its companion, ocean heat content (OHC)? Is MSL accelerating in accordance with the predictions?
Cumulative sea level change from 1905 to 2000, adapted from Holgate (2007), shows a steadily decelerating trend over the period:
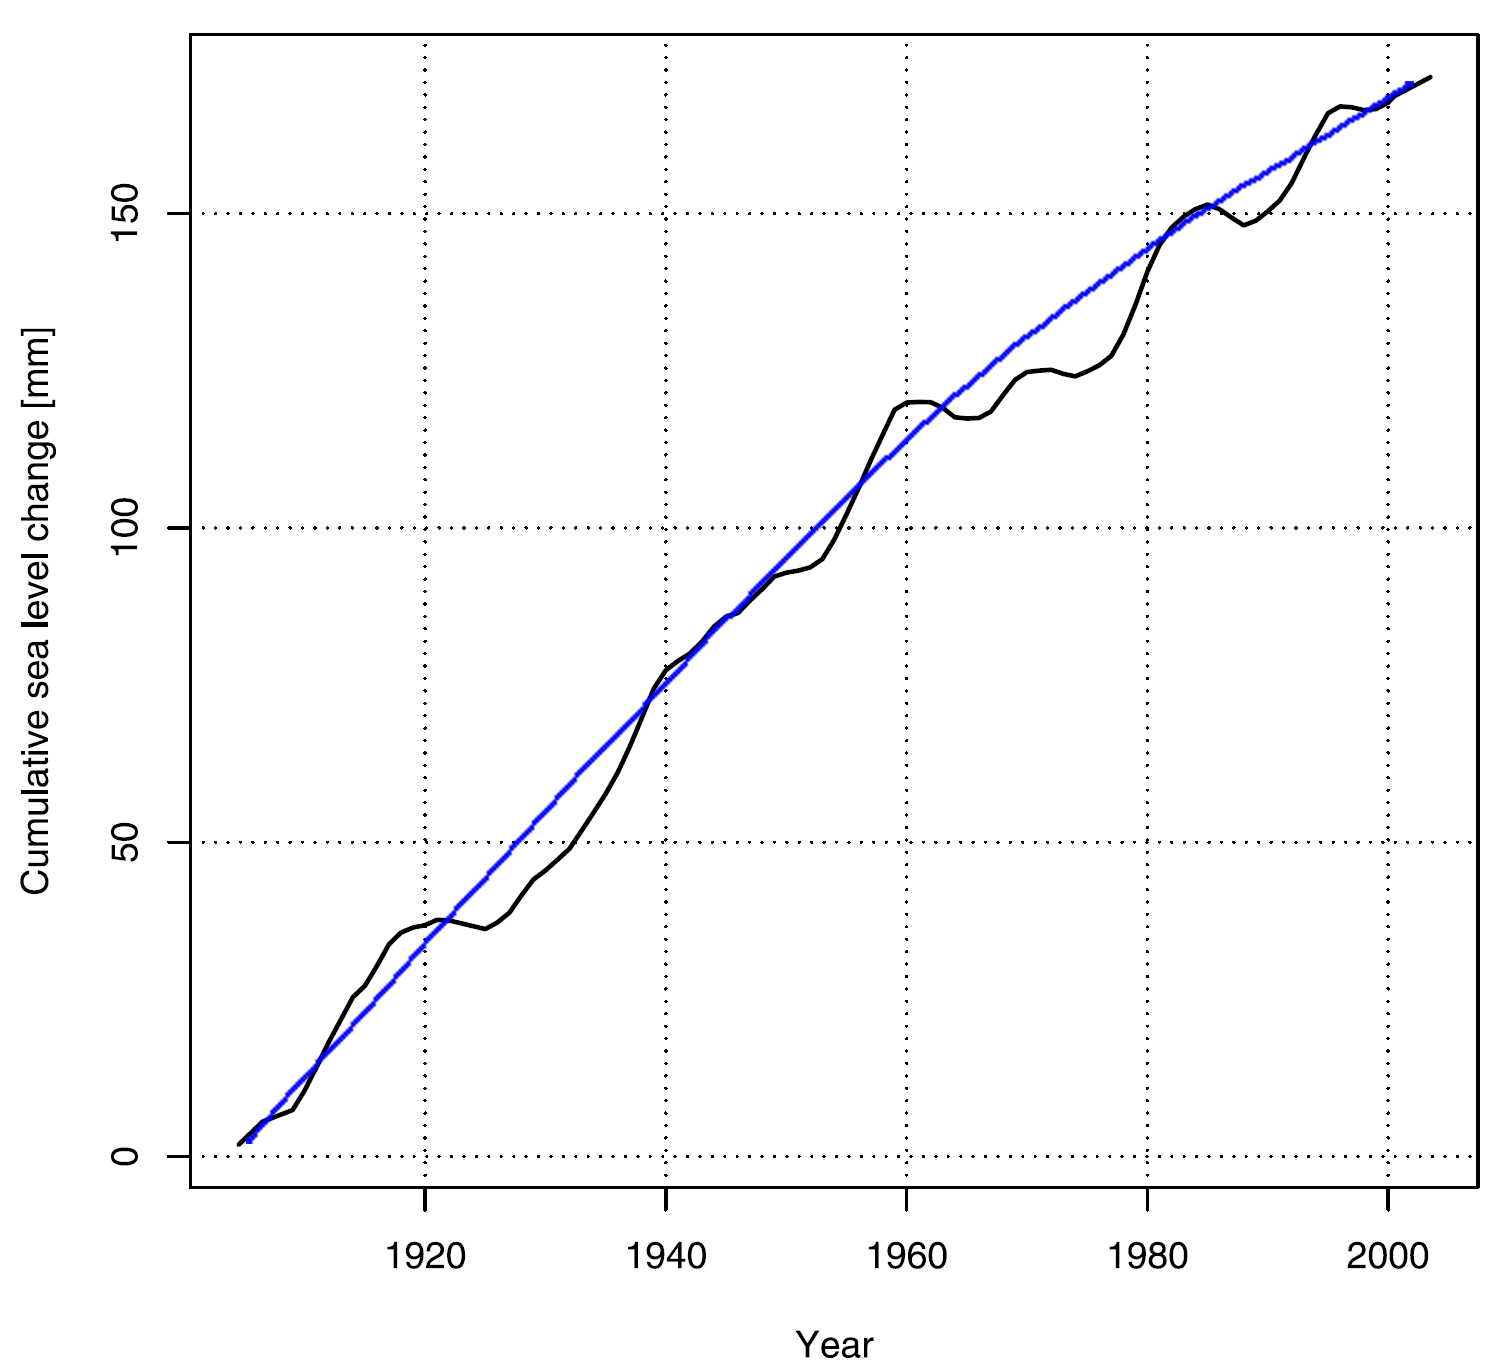
If anthropogenic forcing has had any effect on sea levels, it should be evident in the latter half of that plot but there is no acceleration.
An empirical mode decomposition (EMD) trend was extracted from data supplied by the University of Colorado at Boulder and the resulting 1992 to 2010 trend is here:
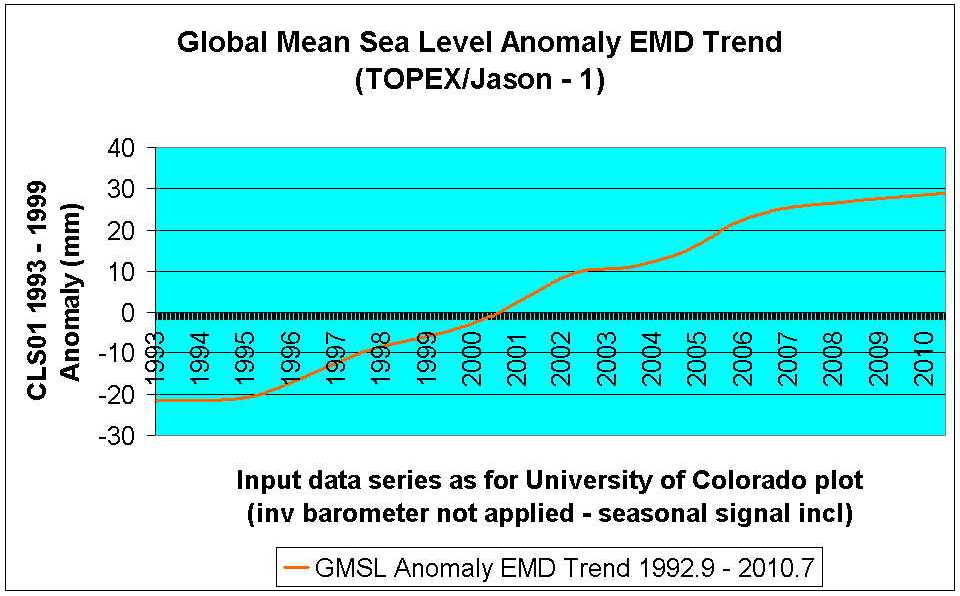
We see a close-to-constant rise (not accelerating) from the end of 1994 to the beginning of 2006, but from 2006 to August 2010 there was a decelerating MSL rise—contrary to AGW and IPCC predictions.
The heat energy in the global oceans has a major effect on MSL due to thermal expansion and contraction, so what is revealed in OHC trends? NOAA NODC provides a continually updated OHC plot shown here:
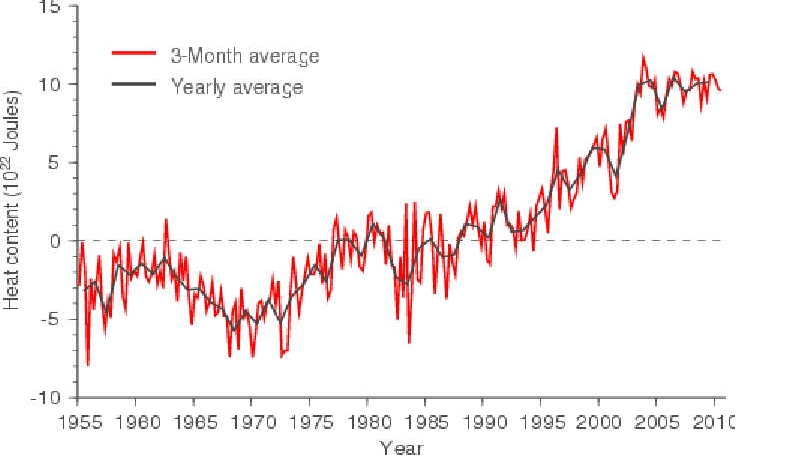
OHC and MSL show similar trends over the last 20 years, but clearly OHC leads MSL, as would be expected. Also clear is the fall in OHC from 2004 to 2010. The fall is detailed from 2004 to the end of 2007 in this graph by Dr Craig Loehle:
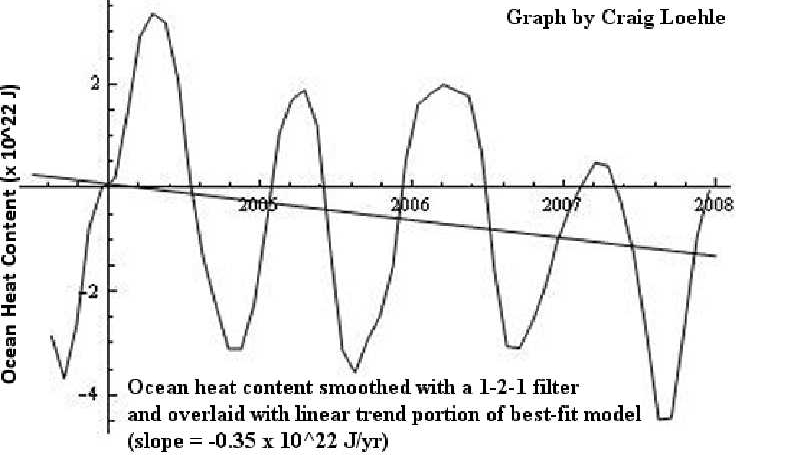
It follows that MSL rise will decelerate when OHC falls, because thermal expansion of the ocean is discontinued. None of these observed conditions support the AGW/IPCC prediction of “an accelerating rate of sea level rise.”
Instead, we see deceleration.
UPDATE 31 JAN 2011
Bob D sent this to us, saying: “Just for interest, here’s a plot of the satellite global mean sea level data.” Thanks, Bob!
Views: 57
The Lyman (2010) plot looks quite different (see RealClimate Jan 11.2011). Schmidt seems to think it is the correct one, i.e. what is really going along. I guess as Trenberth says that 0.85W/m2 is “missing”, and, supported by GS, that the deeper oceans must be heating below the depths even the Argo floats go to.
Isn’t this the sort of thing pyschologists use the term “in denial” for? Skeptics as “affirmers”, and warmists as “deniers”. Heck – let’s create our own terminology, as they do. Imitation and flattery (or is that flatulence?) and all that.
This idea that the deep oceans are heating more than the shallows seems a little hard to believe somehow.
Yes. How would the heat pass through the thermocline? We know the cold bottom water can and does rise by the movement of currents, but I’ve not heard of a method whereby warm water might sink. It would be like hot air sinking to the ground, which is unthinkable.
Doug,
I sympathise with your instinct to apply names more appropriately. It would be satisfying. But I tend to think that what stimulates dialogue is more useful in the long term than what stifles it. Even with the enemy—especially with the enemy. 😉
“The individual OHCA curves all flatten out after around 2003, with some variability among curves in the year in which this levelling occurs. The causes of this flattening are unclear, but sea surface temperatures have been roughly constant since 2000” – Lyman 2010.
“Recently Lyman et al. [1] have estimated a robust global warming trend of 0.63 ± 0.28 W/m2 for Earth during 1993–2008, calculated from ocean heat content anomaly (OHC) data. This value is not representative of the recent (2003–2008) warming/cooling rate because of a “flattening” that occurred around 2001–2002. Using only 2003-2008 data, we find cooling, not warming.
This result does not support the existence of a large frequently- cited positive computed radiative imbalance (see, for example, Trenberth and Fasullo [2]).” – Knox-Douglass 2010.
“Trenberth says that 0.85W/m2 is “missing”, and, supported by GS, that the deeper oceans must be heating below the depths even the Argo floats go to.”
Yes, and probably right now he is planning a Deep Ocean Penetration Experiment (DOPE) at GEWEX to test his hypothesis.
Will they be advertising for a team leader I wonder?
“Head required for Dope Project”
Pielke Snr comments on the lack of recent ocean heating found by Lyman 2010,
“A consequence of this absence of heating is that we should soon see a return to the radiative imbalance predicted by Jim Hansen, if he is correct. Indeed, this provides us the best opportunity we have over the next few years to test the robustness of the multi-decadal global models to predict the climate system radiative imbalance (i.e. global warming).”
http://pielkeclimatesci.wordpress.com/2010/05/21/update-on-jim-hansens-forecast-of-the-global-radiative-imbalance-as-diagnosed-by-the-upper-ocean-heat-content-change/
Bob D’s very good GMSL plot showing a best fit decelerating curve.
http://i51.tinypic.com/do3u41.gif
This would make an excellent update Richart T.