

Wrong again, huh?
Hot Topic, in a post endearingly headed “I’ve been wrong before“, berates the CCG for reporting a criticism of the Royal Society. Chemist Dr Klaus L. E. Kaiser published evidence of miscalculations by the RS which was supported by Swedish Professor of Applied Mathematics, Claes Johnson.
But unfortunately the confidence shown by Gareth Renowden in rebutting this criticism of the Royal Society does not extend to admitting the extent of uncertainty about the carbon dioxide cycle. To listen to Gareth, you’d think the science was settled, but in fact there are substantial unknowns.
He introduces his rebuttal (ignoring his opening paragraph, which contains ad hominem remarks) with this:
Unfortunately for Kaiser and Sullivan, the Royal Society (otherwise known as the most august of scientific institutions, 350 years old this year) didn’t make any schoolboy errors. The amount of CO2 in the atmosphere is determined by the interchange of carbon between the atmosphere, oceans and biosphere. Over the last few hundred years the ocean and biosphere have been doing us a big favour by absorbing two thirds of the CO2 we’ve emitted. The balance has been steadily accumulating, which is why atmospheric CO2 has risen from 280 ppm to 390 ppm.
This seems to be true, although the proportion of human emissions being absorbed by natural processes is specified variously, by different authorities, between about 45% and the 66% Gareth mentions. But whatever figure you take, it does leave a “balance” of an amount which “steadily accumulates”, accounting for a rise in atmospheric concentration from about 280 ppmv to about 390 ppmv now.
But watch the pea under the cup.
What is not mentioned is the strange matter of the increasing disappearance of CO2. Simply stated, as human emissions of CO2 have risen, so has the amount of those emissions absorbed by nature. It seems to remain fairly constant at about 45%.
In other words, no matter (so far) how much we produce, nature is happy to take about half of it. Nobody knows (so far as I have found) how nature manages to keep increasing its absorption of our emissions. But why does nobody talk about it? Perhaps people don’t want to acknowledge just how flexible nature is. Or how little they know of nature.
Live long and prosper in a short life
Another unstated element is the contribution to increased atmospheric levels made by the out-gassing of CO2 from the oceans as they warm. I have seen no calculations of this contribution, and yet, if the water is warming, CO2 will be bubbling out of it. Only a small amount of that CO2, of course, forms part of the anthropogenic emissions budget, yet nowhere have I seen a deduction from the human sources for this out-gassing. The out-gassing also reduces the extent of ocean “acidification” but, again, nobody mentions it.
Gareth then refers us to an article at Sceptical Science describing how, yes, CO2’s atmospheric lifetime is short (five years), but it doesn’t matter because the extra CO2 stays around for centuries. If you can resolve those two competing notions, you’re doing rather well. I felt sceptical and looked for an explanation.
In what appears the thrust of his argument, the author, one Doug Mackie, states:
It is true that an individual molecule of CO2 has a short residence time in the atmosphere. However, in most cases when a molecule of CO2 leaves the atmosphere it is simply swapping places with one in the ocean. Thus, the warming potential of CO2 has very little to do with the residence time of CO2.
Well, how convenient. In such a swift and expeditious manner, therefore, it is explained that we can look forward to an eternity of CO2, whose level never falls, and rises only when a man-made molecule enters the atmosphere. This is surely nonsense. What is the evidence for “in most cases” CO2 molecules are simply swapping places with those in the sea? Why not on land? Why should the oceanic molecules differ in class or quality from those of forests and soils?
Mackie at odds with Royal Society
Considering that each year at least 45% of human emissions are absorbed somewhere, that means about half the new CO2 molecules are not “simply swapping places” with others. Yet Mackie says that “most” of them are. This is sloppy and obscure. Where does his information come from?
Please note how Mackie denies by orders of magnitude the Royal Society’s (long) view of the residence time. Anyone going to criticise him for that? But I agree with Mackie in this: “the warming potential of CO2 has very little to do with the residence time of CO2.”
Gareth now cites Real Climate. A five-year-old article by David Archer talks about the atmospheric lifetime of CO2. The heart of his argument seems to be here:
When you release a slug of new CO2 into the atmosphere, dissolution in the ocean gets rid of about three quarters of it, more or less, depending on how much is released. The rest has to await neutralization by reaction with CaCO3 or igneous rocks on land and in the ocean [2-6]. These rock reactions also restore the pH of the ocean from the CO2 acid spike. My model indicates that about 7% of carbon released today will still be in the atmosphere in 100,000 years [7]. I calculate a mean lifetime, from the sum of all the processes, of about 30,000 years.
So this is really helpful — Archer says he has a computer model. His model makes outlandish claims. Without detailing its calculations, he just enlightens us with its output: 7% of carbon remains after 100,000 years; a mean lifetime of about 30,000 years. Thanks, David. How do you know that three quarters of any new “slug” of CO2 dissolves in the ocean? Why do you ignore all terrestrial sinks? What’s in your model? Why does it disagree with 98% of published estimates?
But the rest of the article is erudite, and reaffirms the CO2-is-here-for-eternity conclusion already stated. There’s an “oops”, though: nowhere does he relate this long lifetime to some kind of sensitivity factor for raising the global temperature. In other words, what of the long endurance? What effect will it have on temperature?
It’s very hard to believe that temperature will continue rising (at least, detectably) because of present levels of CO2. Why? Simply because the temperature response to increased CO2 is more or less logarithmic. Like this:
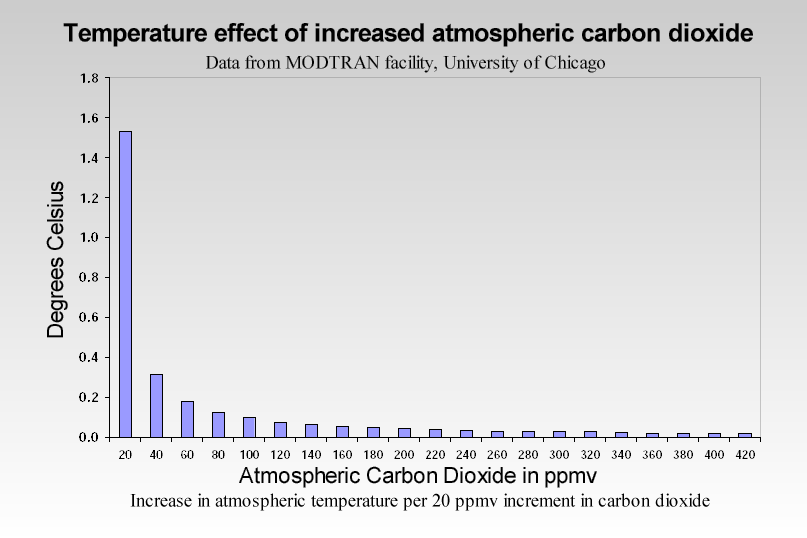
You see, it’s the level of CO2 that determines the temperature forcing, not how long it stays there. Because a certain number of CO2 molecules will cause a measured amount of re-radiation, slowing the rate at which the outgoing IR reaches space. Remaining longer in the atmosphere won’t slow the heat transfer any further. You’ve got to add more molecules, like adding more paint to the window glass, to further slow the transfer and thus increase the temperature.
Put it another way: imagine that the present level of carbon dioxide in the atmosphere remained as it is for the next million years, neither rising nor falling. Cycling through the natural sources and sinks, certainly, but otherwise unchanging. In other words, human emissions stop now. Would you expect the temperature to rise, just because the amount of CO2 does not go down? I certainly wouldn’t, yet that appears to be what Archer is telling us.
The next graph, also from MODTRANS data, takes the CO2 levels higher so we can see what forcing increase to expect from doubling the present 400 ppmv to 800 ppmv — and we find maybe 3 W/m2. Doubling would take, I seem to remember, on the order of 60 to 80 years. And it’s a very small increase in forcing. Would it be obliterated by the tropical thermostat effect described by Spencer?

To recap, the Royal Society proposes an atmospheric lifetime for carbon dioxide of 100 years. That is, compared with over thirty scientific papers, literally an outlier. This chart shows them all:

The best argument against a runaway temperature increase remains our history: It’s never happened before, not even with atmospheric CO2 levels 17 times higher than now.
It’s precisely because of these and other uncertainties that NASA’s Orbiting Carbon Observatory satellite is endeavouring to measure the terrestrial carbon sinks from orbit.
I note that Scott Denning claims about 30% for the ocean sink. That’s a long way from the 75% Real Climate claims.
In the Royal Society position paper on climate change that prompted Kaiser’s allegation of miscalculation which we reported, they say (emphasis added):
about half of the CO2 emitted by human activity since the industrial revolution has remained in the atmosphere. The remainder has been taken up by the oceans, soils and plants although the exact amount going to each of these individually is less well known.
There’s hardly an iota of settled science in sight.
Views: 183
Excellent riposte, Richard T.
I see on the Hot Topic Home page that Gareth’s book comes with a clerical recommendation.
Hot Topic, the first popular science book to examine global warming from a New Zealand perspective, was shortlisted for the Royal Society of NZ’s first ever Science Book Prize. The judges described it as “timely, lucid, and very readable”.
“If I had the money I would send one to every local and national politician and to all congregation clergy. I got mine from the local library.” Rev Bob Scott.
Royal Society of NZ and Rev Bob Scott.
Both belief specialists.
The Climate Change Church has a rampant heretic problem these days and I suspect it is only a matter of time before Dr Judith Curry is officially excommunicated.
Bryan Walker has been laying down the doctrine in “Back in Judy’s jungle”
http://hot-topic.co.nz/back-in-judys-jungle/
“Curry may have a gripe with her colleagues, but it is neither here nor there in terms of what the science means for the actions we should be taking. I notice she seems to be keen on cost-benefit analysis. I don’t know how you sit down and do that sort of analysis in the face of the threat of climate change. When disaster looms you do everything in your power to avert it.”
Walker is a former lay preacher, and not a scientist, by his own admission
I have a personal place for belief and faith – but it’s not in science (or public policy).
The Climate Change Doctrine is Part of Environmentalism, Not of Science – Czech President Václav Klaus
“I notice she seems to be keen on cost-benefit analysis. I don’t know how you sit down and do that sort of analysis in the face of the threat of climate change”
Andrew Bolt weighed in on Economist Geoff Carmody for this ignorant approach:
“Well, I don’t know for sure. I’m just an economist. I’m told the science is subject to uncertainty. I start by assuming there might be a man-made problem. Given that assumption, what is the most cost-effective way to respond? That’s a question we economists can examine.”
“The only consensus on climate change is to chose the wrong policy” – The Australian
http://www.theaustralian.com.au/news/opinion/the-only-consensus-on-climate-change-is-to-chose-the-wrong-policy/story-e6frg6zo-1225942965363
Bolt:
“No, the issue isn’t just whether we’re warming the earth”
http://blogs.news.com.au/heraldsun/andrewbolt/index.php/heraldsun/comments/no_the_issue_isnt_just_whether_were_warming_the_earth
“It is disappointing that an economist as prominent as Geoff Carmody, a co-founder of Access Economics and former senior officer in Treasury, could present such a critically incomplete and simplistic analysis: “
Pielke Sr. defends Judith Curry in SA “heretic” characterization
October 24, 2010 by Anthony Watts
Remarkable Heretic
the Air Vent
Guest post Dr. Judith Curry.
Jeff Id – I asked permission to repost this here in it entirety because it is a perfect description of the current climato-political situation.
http://noconsensus.wordpress.com/2010/10/25/heretic/
“Vegetation plays an unexpectedly large role in cleansing the atmosphere, a new study finds.”
http://wattsupwiththat.com/2010/10/22/plants-play-larger-role-than-thought-in-cleaning-up-air-pollution/
““Our results show that plants can actually adjust their metabolism and increase their uptake of atmospheric chemicals as a response to various types of stress,” says Chhandak Basu of the University of Northern Colorado, a co-author.”
This very good essay by John Kehr discusses the over-blown sensitivity attributed to CO2 in the climate models, looking at the total Green House Effect (GHE) of the planet’s atmosphere (which provides about 30 dC warming – without our atmosphere the planet’s average temp would be about minus 15 dC).
“The flaw in the estimates for climate sensitivity is the assumption that all temperature change is caused by the greenhouse gas forcing. If the climate was as sensitive as the much higher estimates currently in use are, the Earth would be a very unstable place as small changes in energy would cause large changes in temperature.”
“The total GHE of 30 °C is incompatible with the currently accepted IPCC values of climate sensitivity and CO2 forcing. In order for the GHE to be compatible, the total effect of the greenhouse would have to be closer to 100 °C which would result in a global temperature of ~85 °C. This strong overstatement of the climate sensitivity substantially weakens the idea that CO2 could cause measurable change in the Earth’s climate, much less the type of danger that is often being stated.”
http://theinconvenientskeptic.com/2010/10/determining-the-correct-climate-sensitivity/
That essay is an easier read at WUWT if anyone prefers black text on white backgroung.
“Sensitivity Training: Determining the Correct Climate Sensitivity”
http://wattsupwiththat.com/2010/10/25/sensitivity-training-determining-the-correct-climate-sensitivity/
And not just CO2, also see:
“Getting Down To The Root Of Hansen’s Climate Sensitivity Problem”
But the problem lies with the radiative equilibrium calculation (1.) He starts with a WAG (Wild Ass Guess) of atmospheric infrared opacity – 100 times greater than Earth [for Venus].
The statement below is unpalatable, because it assumes no convection.
A quantitative estimate of the greenhouse effect can be obtained under the assumption that only radiation contributes significantly to vertical energy transfer.
Then he assumes that he can calculate the surface temperature based on the total atmospheric opacity? That is ridiculous. The atmosphere of Venus is very thick and is covered with a layer of thick opaque clouds. The total opacity tells us little or nothing about the temperature profile or surface temperature, particularly since he assumes that Venus atmosphere is not convecting – which obviously it is.
Equation 2 is adequate and correct. His usage of equation 1 looks useless to me and apparently is the basis of his theories about climate sensitivity.
Sorry, forgot the link.
“Getting Down To The Root Of Hansen’s Climate Sensitivity Problem”
http://stevengoddard.wordpress.com/2010/10/15/getting-down-to-the-root-of-hansens-climate-sensitivity-problem/
WWF’s shock claim: ‘Time to find a second Earth’ — ‘Humanity will need the capacity of two Earths to absorb CO2 waste and keep up with natural resource consumption’ by 2030
Notice how the WWF article is focusing on biodiversity? This is the new scam now that AGW has run its course.
Climatologist Pielke Sr. Slaps Down Co2 ‘Control Knob’ Paper: ‘Paper does not present new scientific insight but is actually an op-ed presented in guise of a research paper by Science magazine’
Report: Royal Society Humiliated by Global Warming Basic Math Error: ‘Numbers on Co2 are wrong. Royal Society blunder grossly exaggerates climate impact’
Scafetta on 60 year climate oscillations
George Taylor, former Oregon State climatologist writes:
Nicola Scafetta has published the most decisive indictment of GCM’s I’ve ever read in the Journal of Atmospheric and Solar-Terrestrial Physics. His analysis is purely phenomenological, but he claims that over half of the warming observed since 1975 can be tied to 20 and 60-year climate oscillations driven by the 12 and 30-year orbital periods of Jupiter and Saturn, through their gravitational influence on the Sun, which in turn modulates cosmic radiation.
If he’s correct, then all GCM’s are massively in error because they fail to show any of the observed oscillations.
See “Controversy and scandal”
More Lies About CO2
Written by Doug L. Hoffman, Resilient Earth | 24 October 2010
A new paper, penned by a group of known warmist scare mongers, claims to have proof that CO2 is the control knob that regulates Earth’s temperature. Andrew A. Lacis, Gavin A. Schmidt, David Rind, and Reto A. Ruedy, all from NASA’s Goddard Institute for Space Studies, are boasting they have experimental proof that “carbon dioxide is the single most important climate-relevant greenhouse gas in Earth’s
New Zealand’s Emissions Trading Scheme
Nan Jiang, Basil Sharp* and Mingyue Sheng
Department of Economics, The University of Auckland, New Zealand
1. Introduction
The schematic framework of climate change used by the Intergovernmental Panel of Climate Change (IPCC) has the following four components: climate process, climate change, impacts and vulnerability, and socio-economic development (IPCC, 2007). Beginning with climate process, two undisputed facts are evident.
First, the role that greenhouse gases (GHG) play in trapping energy and making the atmosphere warmer is not disputed.
Second, evidence shows that the atmospheric concentration of many GHG has increased markedly as a result of human activity. Global GHG emissions increased by 70% over 1970-2004 and carbon dioxide (CO2) is the most important GHG and accounted for around 77% of global GHG emissions in 2004 (IPCC, 2007). Other GHG include methane and nitrous oxide. To account for differences in their warming potential gases are expressed through a common metric based on CO2 viz. carbon dioxide equivalent (CO2-e). For example, methane – which is of particular relevance to New Zealand (NZ) – has a warming potential 21 times that of CO2.
Beyond these two facts uncertainty arises. Warming of the climate system is evident from observations on increases in global air and ocean temperatures, and rising global average sea level (IPCC, 2007). One uncertainty is associated with the scientific challenge of identifying, and controlling for, natural vis-à-vis anthropogenic drivers of climate change. While the likely consequences of global warming are becoming more clear the frequency, and changes in the spatial patterns, of adverse climate events is uncertain. For example, extreme weather events, such as heat waves, are likely to become more frequent and more intense (IPCC, 2007). The degree of uncertainty further increases as climate change is mapped into impacts on ecosystems, food production, health, coastal settlements, water, and regions. In the case of New Zealand, the Ministry for the Environment reports that it is most likely that: sea level will rise by 30-50cm by 2010, leading to increased coastal erosion, coastal flooding, and salt water intrusion; average temperature is expected to increase by 1o C by 2030; less rain will fall on the east coast resulting in an increase in demand for water; and, westerly winds will become more prevalent (Ministry for the Environment, 2007). The main feature of the Kyoto Protocol adopted in 1997 is that it set binding targets for 37 industrialised countries and the European Union (EU) for reducing GHG. While instrument choice is a matter for sovereign governments to decide the Protocol does offer three market-based measures: emissions trading, clean development mechanisms (CDM), and joint implementation (JI) projects. Country-level emissions are monitored and recorded, emission reductions achieved through CDM and JI projects are verified, and an international transaction log tracks trades that occur. New Zealand ratified the Kyoto Protocol in 2002 committing it to reducing average net emissions of GHG over the first commitment period (CP1) 2008-2012 to 1990 levels or to take responsibility for the difference. As at October 2008 New Zealand’s obligation was $NZ 593 million (Treasury, 2008).
[See Economics]
Thanks Richard – this is an interesting and very informative look at the state of the NZ ETS.
The document was created on 9/04/2009 – had to look this up in the doc properties as no date was shown on the title page.
Given the brain-dead naivety in the paper – were you really expecting a date?
Not a lot of learning going on at the Department of Economics, The University of Auckland, it seems, and their critiquing ability needs some work too, I think.
This lame acceptance of IPCC “science” by Economists is symptomatic of a world-wide phenomenon as can be seen in the “Economics” link I provided.
The trend (it will be apparent in AR5), is to climate-economic coupled models, so that ACO2 is “hard-wired” right through to the output for the digestion of policy makers who have not got a clue of the scientific fundamentals and the intrinsic ACO2 “hard-wiring” of the IPCC model stable with subsequent economic coupling.
I recommend downloading to Excel a simple climate model from the following link as an example of an alternative implementation that was created by Dr Roy Spencer.
It will give any user a “feel” for non-IPCC climate modeling and the different results achieved using genuine natural forcing – not the IPCC prescribed RF methodology.
Climate Models
NON IPCC and Natural Forcings ONLY
Simple Climate Model Release, Version 1.0
https://www.climateconversation.org.nz/open-threads/climate/climate-science/#comment-27281
The paper states
One uncertainty is associated with the scientific challenge of identifying, and controlling for, natural vis-à-vis anthropogenic drivers of climate change
Well, who would have thought it?!
So their “uncertainty” arises from their blind acceptance of “facts” – seems reasonable.
But perhaps if they paid a little more attention to the “undisputed facts” that are “not disputed”, they might have some certainty in their “uncertainty”.
I’m not sure what the point of this paper was, but I felt it was an interesting outline of the historical development of the ETS and how it positions NZ (favorably or otherwise) in the international scene. I realised it was an economic essay and therefore did not address uncertainties in the science, although these were briefly mentioned and glossed over. The focus was on the economics of the Kyoto obligations and carbon trading. Interesting, but hardly earth-shattering.
As an aside, the typos and grammaticals within suggest that it was written more by Jiang and Sheng than Sharp.
A desperate attempt to get everyone thinking and commenting about:
“The intrinsic ACO2 “hard-wiring” of the IPCC model stable”
Please note how the Dr Spencer’s Simple Climate Model in Excel (linked above) takes Input Parameters from SIMULATED empirical satellite measurements of global (a) cloud cover and (b) surface evaporation
The IPCC stable does NOT do this to date.
i.e. The IPCC models are a throw-back to pre-satellite days and the methodology has not changed to take advantage of the new technology (wonder why?).
Also, Roy Spencers facility to enable CO2 forcing to be toggled on/off provides an instant and far more realistic comparison of ACO2 forced and naturally forced simulations.
The IPCC simulations run on supercomputers take days to spin up to equilibrium using bogus spin-up datasets then weeks to carry out simulation scenarios (equally bogus).
To carry out ACO2 vs Natural simulation scenarios, the process must be started from scratch for either run.
[Note- NIWA,s UM is in the IPCC stable]
I sent this email to Weta Digital Re: Computer Utilization out of curiosity:
To whom it may concern,
I have an interest in climate modeling and note that NIWA has their HPCF up and running using the UKMO UM model.
It has occurred to me that Weta Digital may be looking for ways to gain maximum utilization from its computing capacity between intensive film making efforts.
The climate modeling scene is huge world-wide but there is an as yet unexplored avenue.
Digital climate model simulations to date are from the IPCC stable that use an out-dated methodology i.e they do not use input parameters taken retrospectively and in real-time from satellite empirical observation data so that the various climate forcings are derived naturally rather than the IPCC methodology of human imposed assumptions.
The IPCC stable of super-computer simulations are also cumbersome, requiring long spin-up times, very long scenario simulations and the necessity to start from scratch for different humanly assumed forcing scenarios. A real-time methodology taking satellite data negates all that although obviously the simulations would have to be run on to provide predictive capability.
A quick and easy example on an Excel spreadsheet can be downloaded here:
http://www.drroyspencer.com/2010/04/simple-climate-model-release-version-1-0/
And there is a forum for discussion here:
https://www.climateconversation.org.nz/2010/10/like-diamonds-co2-is-for-ever/#comment-27613
It seems to me that what is needed is some Kiwi ingenuity applied to digital climate modeling but it is disappointing that NIWA has purchased an old technology, off-the-shelf package so they really need some competition from the private sector – why should NIWA get all the government funding for a New Zealand climate modeling venture when there are no results being produced from real-time simulations for comparison to NIWA’s results?
The lack of comparison is international and I am sure that other funding options could be found from overseas sources.
Note that the UK Met Office (UKMO) has a very bad track record in the predictive capability of its UM simulations.
Regards,
Richard Cumming. (NZ)
Richard
This sounds like a great initiative. I am not clear how much work would be required to create a climate model from scratch.
I’d dearly love to see the code in existing models.
Hope it’s better than HarryReadMe.txt
“I’d dearly love to see the code in existing models.”
GISS ModelE Browser here:
http://www.giss.nasa.gov/tools/modelE/modelEsrc/
ModelE1 is the version that is frozen for the AR4 submission.
I have a zillion links in this regard so just yell as you need to take the next step – I can save you some time.
BTW – Steve Mosher has:
“slogged through almost the entire 100K lines of ModelE. Now I am I starting On the MIT GCM which is much easier. So, Some of us have earned our potshots. In walking through ModelE I found nothing to reccommend it. No test cases. No test suites. No test drivers. No unit test. No standardized test. At one point gavin directed me to a site of “test data”. I found errata exposing monumentaly stupid programing blunders that your worst GT undergraduate programing student wouldnt commit to a daily build after an all night bender Worse, when I requested access to the IPCC data, I was denied. Private citizens cannot get access to this data . You want to talk about irrational. Irrational is this: no spec. no coding standard. no test plan. No verification. No validation. No manual. No documentation. No public access. no accountability.”
The preceding quote is linked in this classic document from Feb 2008 at Climate Audit:
http://climateaudit.org/2008/02/03/curry-reviews-jablonski-and-williamson/#comment-135142
So I suggest that you don’t become fixated by ModelE and instead move on to superparameterizes models, Dr Spencer’s Simple Climate model in Climate Science (and searching for full scale equivalents) and NIWA’s UM (see Climate – Climate Models, NOT Climate Science).
ModelE is rapidly becoming an outlier and irrelevant which explains the recent desperation by GISS. I got my take on this confirmed by second opinion here:
https://www.climateconversation.org.nz/open-threads/climate/#comment-26296
A relevant comment from Dr Roy Spencers “Does CO2 Drive the Earth’s Climate System? Comments on the Latest NASA GISS Paper”
Bill Illis says:
October 21, 2010 at 5:08 PM
I have two comments,
First the paleo record cannot be used for CO2 sensitivity estimates unless the proper Albedo values are used (as noted above by a few posters).
Let’s take the most extreme example known about. The highest CO2 estimate we have is 12,000 ppm, 635 Mya, just when the last Snowball Earth episode was starting to break-up (although CO2 was certainly higher in the far distant past). What was the average Earth Temperature 635 Mya? -20C, water vapour levels were extremely low, land glaciers were as much as 5 kms high and sea ice extended to the tropics. Now that is with the highest CO2 estimate on record. Obviously, all that snow and ice had something to do with temperatures being 35C lower than today while in GISS ModelE’s world, the temperature should have been 15C higher than today – the basic proposition is only off by 50C. I don’t know how one would calculate how far off the water vapour proposition is as well.
Now let’s extend that “off factor” to the Last Glacial Maximum (which is used by Hansen as a semi-verification of the 3.0C per doubling proposition). What Albedo value did he use? Does using an improper Last Glacial Maximum Albedo value produce a situation just like “50C off factor” of the Snowball Earth episode. Most definitely.
Secondly, the 3.0C per doubling of CO2/GHGs is actually based on GHGs controlling 80% to 90% of the water vapour levels. If CO2/GHGs do not in fact control 85% of the water vapour levels, then the 3.0C per doubling proposition is wrong and GISS ModelE is also wrong.
http://www.drroyspencer.com/2010/10/does-co2-drive-the-earths-climate-system-comments-on-the-latest-nasa-giss-paper/#comment-3630
From the CRU emails:
There are clearly an infinite number of possible alternative futures to
explore. We have consciously applied the principle of Occam’s Razor ,
seeking the minimum number of scenarios to provide an adequate basis for
climate modelling and challenge to policy makers. The alternative futures
constructed are not, and cannot be, value free since like any work they
self-evidently reflect the team’s view of the possible. The scenarios
should not be construed as being desirable or undesirable in their own
right and have been built as descriptions of possible, rather than
preferred, developments. There can be no objective assessment of the
probability of the scenarios, although in the prevailing zeitgeist some
will appear to individuals to be more likely than others. Scenarios are
built to clarify ignorance rather than present knowledge — the one thing
we can be sure of is that the future will be very different from any of
those we describe!
http://www.eastangliaemails.com/emails.php?eid=54&filename=889554019.txt
You really do like that database Andy.
That email was 1998. As I understand, the scenarios Anne Johnson describe are now codified in this document:
IPCC SPECIAL REPORT
EMISSIONS SCENARIOS
Hence the SRES acronym.
I familiarized myself with these on my “Climate Model Odyssey” and comment # 208 in this thread at JoNova shows how they are used in PCMDI specifications for model simulations.
http://joannenova.com.au/2010/08/head-of-australian-science-academy-issues-decree-from-pagan-chieftans-of-science/#comments
Introduction to the Vehicle Economy Standard – NZ MoT
February 2009
Why are we proposing a Vehicle Economy Standard?
* Evidence indicates the climate is changing.
* New Zealand’s greenhouse gas emissions are growing.
* Transport is a significant contributor to New Zealand’s emissions footprint.
* The New Zealand Government takes climate change and sustainability very seriously.
* Reflected in the targets contained in the NZES and the NZEECS.
* Reflected in the “Sustainable Transport” documaent.
* Emissions Trading Scheme will help but…
Evidence indicates the climate is changing: IPCC 2007.
See – ETS and carbon taxes and Energy and fuel and Economics
Evidence indicates the climate is changing…”Evidences will be provided Eminace!”…..see to it! 🙂
Depressing meeting yesterday.. A conversation with the Minister with David Carter in Christchurch. “this government is not going to abandon the ETS and the main other party is for it as well..it’s here to stay”
Like diamonds, CO2 is forever. The same cannot be said for political parties.
If they continue to treat us like idiots, they deserve our contempt.
I see NIWA are continuing with their Warming agenda by saying on TVNZ , a female NIWA climate scientist, stated falsely that La Nina will bring warm weather, totally contradicting NASA and others that La Nina produces a ‘cooling of the Pacific basin’ and will bring severe winters to the NH this winter. I notice hat this sort of announcement always occurs when were having a calm warm spell. Never mind that I had to put a pullover on today.
“La Nina tends to bring more northerly or easterly winds to New Zealand, so warmer, wetter in the North and East,” NIWA climate scientist Georgina Griffiths said.
NIWA forecasting a warm early summer
Yes Quentin, there’s a cool wind coming off the Pacific at the moment and the sea is cold too at Mt Maunganui. It was made warmer by calm conditions but now it’s choppy and not so warm. The TVNZ reporter said the sea will get warmer – “Sea temperatures will also be warmer than normal”, that I assume came from NIWA but I’m not so sure looking at the Current Sea Surface Temperature Anomaly Plot:
http://weather.unisys.com/surface/sst_anom.html
Although generally I agree with the “warmer wetter” prediction for NZ atmospheric temps. It is the eastern Pacific that is cooler (O and A) during La Nina and it is apparent in the UNISYS plot. But also apparent is how the rest of the planet’s oceans and lakes are in a cooler phase.
The TVNZ clip was on this page but there’s a broken URL (to me):
http://tvnz.co.nz/search/ta_ent_search_news_skin.xhtml?q=la+nina+niwa&sort=date%3AD%3AS%3Ad1
I did disable Flash player for faster browsing so that might be the reason.
Thanks Richard
” as human emissions of CO2 have risen, so has the proportion of those emissions absorbed by nature. It seems to remain fairly constant at about 45%”.
This was also the finding of a Bristol U research team, which concluded that the respective proportions of CO2 taken up by the hydrosphere and the biosphere remained constant over time.
So let’s assume that the biosphere’s sequestration share is fixed at (say) 24% of all new CO2 introduced to the atmosphere. Now, what happens if we plant 10 billion trees? Nothing! The biosphere’s uptake remains at 24%. Equally, there will be no change if we chop down 10 billion trees.
Can somebody please explain why we have an expensive ETS, designed to save the world by planting trees?
ETS = Political CYA
When you have guys like Kennedy Graham wibbling on about climate change, we have our work cut out
We are thus authorised by Her Majesty’s loyal ministers to explain to our children, in 20 years’ time, that while we recognised the magnitude of the challenge, we only did what we thought possible at the time.
[ He forgot to mention the Puppies ]
http://blog.greens.org.nz/2010/10/28/questioning-nick-smith-on-climate-change/
” The best argument against a runaway temperature increase remains our history: It’s never happened before, not even with atmospheric CO2 levels 17 times higher than now.”
Everybody seems to agree that either warming or cooling of the atmosphere (however caused) will produce both positive and negative feedbacks. The debate is whether the net effect of all the complex feedbacks is to offset the initial movement or to exacerbate it.
This issue must have arisen many times during the past 4 billion years. If exacerbation occurred when it became warm, the globe would have become hotter and hotter for a few million years until all life was fried away. That didn’t happen, as the earth self-corrected on every occasion. Knowing this, why do some scientists say “it’s different this time”?
There’s quite a good article at The Register covering Climate Fools Day in the UK.
http://www.theregister.co.uk/2009/10/30/climate_fools_day/print.html
With specific relevance to this post, there is mention of the presentation by Peter Gill on the residency time of CO2.
He had an interesting calculation I hadn’t heard before. The human contribution to CO2 is 26 gigatons a year. It’s peaked in the past, however. Assuming all that was anthropogenic, between 1820 and 1855 the peak was 44gt a year and between 1942 and 1953 78 gigatons a year. Where did it go, he asked? If the lifespan was anything like the “consensus” supposes, this would still be hanging around. He concluded that “the variability of emission and absorption by natural processes exceeds current anthropogenic emissions.”
C3 Headlines
More Evidence That Global Warming Is Becoming A Global Cooling Trend, Despite CO2 Growth
Siberian-Arctic Tundra Thawing Creates Negative Feedback, Opposite of AGW Climate Model Predictions, Experts Find
Duke Scientists Accuse Global-Warming of Summer Rainfall Variation: Evidence Finds It ‘Not Guilty’
Global Cooling Is Here, Pt. XIII: Where’s The Freaking Global-Warming Promised Us!
NASA Global Warming Research: Last Decade of Data Shows Vast Areas of World Not Warming
Peer-Reviewed Studies: Documenting The Evidence That Disproves The IPCC Global Warming Science
Well, I’m a bit time poor but I believe that one of the necessities in trying to get your point of view across is to comment on climate alarmist blogs:
so today I commented at http://www.abc.net.au/unleashed/40652.html#comments commenting on an opinion piece by Stephan Lewandowsky Climate change: are you willing to take the risk?
this is the comment:
Corrupted science is evidenced by the Climategate e mails and in my view the IPCC has been totally discredited by its reliance on that and on the voluminous non scientific material stated as fact in its last report. As Professor Carter says … “there is a degradation, mainly by political interference, of research conditions and practices within modern government-funded research groups pushed by the power and financial clout of the modern, ecoevangelistic Green movement, egged on by crusading media reporters and editors. The world has probably never before seen a propaganda and political machine that is as well oiled, well funded and well organized as this modern army of apocalyptics and their media flag-wavers.
But voters who respond to the siren song of the Greens imperil both our standard of living and, ironically, the state of our natural environment. For every dollar that is spent on a false environmental issue such as dangerous human-caused global warming is a dollar that is not available to be spent on a real environmental or social problem.”
And where’s the warming?
I sent a copy of the comment to Professor Carter referring to the source http://www.abc.net.au/unleashed/27600.html
I think it essential that persons who do not believe in ‘climate change’ put comments on all alarmist sites as a way of spreading the word; it might make somebody think
What do others think; and what do others do to spread the ‘denialist’ viewpoint?
I suppose what I’m concluding is that sites like this site are wonderful but to spread our beliefs we have to be prepared to take the flack in left wing forums; I mean alarmist forums; unfortunately I don’t have the expertise of Richard C; Richard T; Richard Courtney or Andy and many others I could name but I’ve done a lot of reading since Climategate and being legally trained I rely on the words of experts; should we have a new thread called ‘accomplishments’ so each of us can put what we’ve done to spread the denialist word so to speak on a day to day basis
I agree with getting your word heard. Comments on MSM sites are worthwhile, warmist blogs are a waste of time (their science is settled, after all).
I don’t “believe” or “deny” AGW, these are not words that I associate with science. They are the words of religious dogma.
I don’t like the word “denialist” because of its connotations. Mind you, Richard Lindzen reckons we should stop using the word “sceptic” because it implies that there is a plausible hypothesis to be sceptical about.
Above all, I don’t think we should be afraid to speak our minds, even if we fear ridicule. With some of the talk of “crimes against humanity” re-emerging from Penn State University, we should stomp on these would-be destroyers of our freedom like cockroaches.
To quote Thomas Jefferson:
All tyranny needs to gain a foothold is for people of good conscience to remain silent.
There’s some guy called “Watching the Deniers” who is making a list of Australians he considers to have committed crimes against humanity because of their views on climate change
See in the comments
http://hot-topic.co.nz/crime-of-the-century/
This list includes most of the Aussie climate community – including Bob Carter – who have dared criticise the IPCC “consensus”
Some of these guys make the Gestapo look like the Salvation Army.
I notice that one of those that “Watching the Deniers” is watching – Jo Nova has just tipped over 2 million page views in the last 12 months (is that a tipping point?).
She has also come up with “Who are the deniers now?”
http://joannenova.com.au/2010/11/who-are-the-deniers-now/
So now the sceptics are playing the “Watching the Deniers” game.
But Andy, while I accept what you say there’s no harm in using a word which is in general use in what you could call the ‘opposing faction’ and you need to be used to the words the warmist believers use when you are in their environment notwithstanding you don’t like them
Val,
It is a standard tactic in propaganda to demonise the opposition. Using the word “denier” is just this, and that is why I chose not to use the term.
Anyway, I am not denying that the climate is changing (it always has), or that the world is warming (although the temperature records appear to be a bit dodgy). I can even accept that CO2 may have a role in that, possibly minor.
What I do doubt are the alarming prognostications of the IPCC and the climate change lobby groups.
I prefer the term “climate realist”.
A coincidence that you were doing that at ABC Val, because we have been doing the same thing on this side of the Tasman in the NZ Herald Environment section:
http://www.nzherald.co.nz/environment/news/article.cfm?c_id=39&objectid=10684627
Richard T, Andy and myself have not only engaged in the issue there but have invited discussion right here in this forum – no takers so far.
I saw the ABC article and read some of the comments but decided it was better to leave it to the locals such as yourself. I agree that we should engage in discussion outside our comfort zone from time to time but there’s not a lot of meeting of minds in polarized forums so it’s just a matter of expressing views and if we don’t express them, they don’t get read.
Re ‘accomplishments’. I have documented some of my encounters (linked to the threads) under “Troublesome Trolls” in “Disproving AGW” but I have to confess that one (Not-Richo) took me to the cleaners and I learned a great deal from that.
I have joined discussion at a blog dealing with Radiative Heat Transfer that will be a series of posts you might be interested in following:
http://theinconvenientskeptic.com/2010/11/radiative-heat-transfer-simple-overview/comment-page-1/
I’ll be very interested in what develops there as the issue of the 2nd Law of Thermodynamics is right at the centre of the CO2/AGW proposition and I hope to extend my knowledge in that area (and maybe adjust my understanding). I’m grinding through G&T as a warm up so thanks for bringing that paper front-of-mind Val.
This great comment from Rick Bradford on BH
Michael Mann has too much to lose by giving even an inch on these issues, and his stance will continue to be “Admit nothing; deny everything.”
Mann is the Trofim Lysenko of the CAGW movement — the young scientist who found political favour and turned it into a scientific movement.
The parallels between Lysenkoism and CAGW are unmistakeable, as Cliff Ollier, Nils Roll-Hansen and others have noted:
1. Work first through political organisations.
2. Claim that the science is settled. There is nothing to debate.
3. Disregard or deny all the accumulating evidence that the predictions are wrong.
4. Demonise the opposition (Mendelian geneticists; deniers of Global Warming).
5. Victimise the opposition (execution and exile; loss of jobs or research funds).
6. Relate to a current ideology (Stalinism; Environmentalism).
7. Support a vast propaganda machine.
8. Create a huge bureaucracy where many people have careers dependent on the ruling concept.
When discussing parallels, it is worth noting that Lysenko’s crackpot theories helped ruin Soviet agriculture for 25 years and killed millions of people through famine.
http://bishophill.squarespace.com/blog/2010/11/2/mann-in-new-scientist.html#comments
I’ve read most of Aleksandr Solzhenitsyn’s books including Gulag Archipelago and they are harrowing accounts.
He was denied writing material so memorized his writings using poetry and a rosary. Every tenth line of verse corresponded to a rosary bead so he was able to keep track of his narrative. He could memorize 20,000 lines of poetry in this way.
They had to light fires to melt the permafrost before they could excavate the Volga canal each day.
Great Richard; pleased you are involved in other sites
I’ll keep an eye on the sceptic blog; back radiation does confuse me from a modelling point of view; if you accept that it exists as most of the warmists do and it does not exist then what happens to computer model projections; are they doubled or what?
Oh well, I’ll never know all of that but I do admire Solzhenitsyn; my favourite was ‘Cancer Ward’
but my favourite Russian author is Maksim Gorky
“if you accept that it exists as most of the warmists do”
Not just warmists (I know it exists), there’s programs underway that measure LWIR back radiation – BSRN for example
https://www.climateconversation.org.nz/open-threads/climate/climate-science/atmosphere/#comment-28093
The problem for warmists is that the heating ability of solar SWIR is spent once it is reflected and the wave-length changes to LWIR. Also the offending 1.7Wm2 of CO2 is totally insignificant in the context of 400Wm2 total LWIR back radiation.
“and it does not exist then what happens to computer model projections; are they doubled or what?”
The GHG’s do re-radiate energy but now you are getting to the core contentious debate. The warmists (Hansen predominately) make CO2 the major climate driver so the models are hard wired accordingly. This is the “circular reasoning” we are hearing everywhere. As Dr Roy Spencer says:-
“After assuming clouds and water vapor are no more than feedbacks upon temperature, the Lacis et al. paper then uses a climate model experiment to ‘prove’ their paradigm that CO2 drives climate — by forcing the model with a CO2 change, resulting in a large temperature response!
Well, DUH. If they had forced the model with a water vapor change, it would have done the same thing. Or a cloud change. But they had already assumed water vapor and clouds cannot be climate drivers.”
http://www.drroyspencer.com/2010/10/does-co2-drive-the-earths-climate-system-comments-on-the-latest-nasa-giss-paper/
You can easily compute Hansens CO2 forcing in the models by external calculation here:
https://www.climateconversation.org.nz/2010/09/new-unfccc-climate-chief-no-worse-than-the-old/#comment-24527
There’s also the little matter of the hockey stick spliced spin-up datasets – that’s the biggest model illusion, the Mauna Loa set provides the uptick for 80’s-90’s warming – pity there’s been no warming last decade though.
Forgive me for preaching and brow-beating but I want to make a point re the use of the 2 historical CO2 datasets – Law Dome ice core and Mauna Loa.
We basically have three groups in the debate – warmists (e.g.RealClimate, Hot Topic), luke-warmists (e.g. Anthony Watts) and hard-core sceptics (e.g. Hockey Schtick, C3). I’ll declare now that I am to the right of the last group and yes that is possible as I will describe.
You will not see many graphs and plots such as those put up by Richard Treadgold in his post above at warmist sites (they specialize in textual debate – hide the evidence) for obvious reasons but you will see pages of them at luke-warm and hard-core sites again for obvious reasons.
Anyone seriously entering the debate should by now be able to recognize (I like zeds, RT, zzzzz) instantly the shape of the Law Dome – Mauna Loa CO2 dataset splice whenever it turns up in a graph being viewed. If you can’t, you’re not serious and you don’t know what you are talking about and it doesn’t matter whether you have a Ph.D or not.
Here’s the the CO2 historical spliced dataset in blue (ignore the temperature and sunspots):-
http://en.wikipedia.org/wiki/File:Temp-sunspot-co2.svg
What is lamentable to me is the misrepresentation of this splice even at hard-core sites because what happens is that the distinction between the 2 datasets in the splice is removed and what is left is 1 contiguous line and the join is indistinguishable to all but the discerning e.g. from the hard-core C3 site:-
http://c3headlines.typepad.com/.a/6a010536b58035970c01348887ea36970c-pi
Yup, same data, different presentation.
If either of these 2 datasets had been used over the years instead of the splice, whether in models or elsewhere, the warmist CAGW case would be instantly NULL and we would not be having this discussion.
Richard,
I don’t quite follow this. I understand that there is a splice between Law Dome and Mauna Loa (although I am not quite sure where it is, exactly)
However, how does this invalidate the CAGW argument?
It does seem like a somewhat different issue to the “nature trick” data splice.
“I don’t quite follow this. I understand that there is a splice between Law Dome and Mauna Loa (although I am not quite sure where it is, exactly)”
If you look at the Wikipedia plot
http://en.wikipedia.org/wiki/File:Temp-sunspot-co2.svg
The splice is where the smooth line joins the jagged line.
Scroll further down the page,
Click on 1 (light blue) Law Dome CO2 Data: ftp://ftp.ncdc.noaa.gov/pub/data/paleo/icecore/antarctica/law/law_co2.txt
This gives you the Law Dome data you could plot in Excel (or anywhere).
Click on 2 (blue) Mauna Loa CO2 data:http://www.esrl.noaa.gov/gmd/ccgg/trends/co2_mm_mlo.dat
This gives you the Mauna Loa data that can also be plotted in Excel
These are EXACTLY the spin-up datasets that are used to get the IPCC GCM’s into “equilibrium” before simulations commence (ACO2 “hard-wiring”, although Gareth Renowden disputes this – without basis I suspect ).
As I described up-thread, you can easily compute Hansens CO2 forcing in the models by external calculation using that data:
https://www.climateconversation.org.nz/2010/09/new-unfccc-climate-chief-no-worse-than-the-old/#comment-24527
“However, how does this invalidate the CAGW argument?”
Simple, if either of these datasets are used to calculate CO2 forcing independent of the other, whether in models or by external calculation you can do yourself – the results will be gibberish. Obviously both sets would have to be extended to do so; Law Dome forward; Mauna Loa backward (not sure if the data exists). So obviously a calculation for year 2000 say, using Law Dome data (if it exists) will not yield the same figure that results from using Mauna Loa ppm value for that year.
Similarly, a calculation for 1940 using Mauna Loa ppm value for that year (if it exists) will not yield the same value that results from using Law Dome ppm value for that year.
“It does seem like a somewhat different issue to the “nature trick” data splice.”
Not that different at all, just that nothing is hidden, but they are disparate datasets just the same as the “nature trick” data splice in order to achieve the desired up-tick – you’ve been conned.
I’m not sure that I’ve been conned, as I never thought about this issue before. Anyway, I appreciate your explanation, Richard, and will look into it further.
Well the new congress is on to it.
http://www.infowars.com/new-republican-house-promises-investigation-of-global-warming-fraud/
Why CO2 levels change after temperatures change.