
We show you what this ‘climate crisis’ looks like
The NZ Herald recently published Exxon, shark attacks and America’s climate crisis, an article by senior writer Simon Wilson. He raises numerous alarming aspects of climate but omits to support them with facts. For example, he describes how a group of activist shareholders want ExxonMobil, the largest oil company in the Western world, to confront the climate crisis, but there’s no crisis—I show you the facts.
In the same breath as climate change (which means global warming), Wilson mentions shark attacks, recycling human waste, frozen mammoths and other freakish topics. We’ll have a brief look to see whether he’s on track with these facts.
Elements of weather most commonly understood as part of the climate are Temperature, Precipitation (rainfall) and Cloudiness. Humidity, Wind, Air pressure and Solar radiation are also important to meteorologists and climate scientists, but we’ll stick to the big three.
To know the temperature is to kill the climate crisis
TEMPERATURE FACTS
Temperature is the leading climate metric, because if there’s no warming, there’s no crisis, no calamity. If a reporter refuses to tell you the temperature, ask him why. We should note that there has been patchy, minor recent warming, from 1910 to 1940 (0.5 °C), from 1987 to 2003 (0.2 °C) (HadCRUT4), among significant variability. The temperature in June finally returned to the long-term average (UAH). In 2009 NIWA claimed New Zealand had warmed by 0.92°C from 1909–2008, and according to the IPCC, over the 20th century the globe warmed about 0.6°C. This is insignificant warming and any other number is either a guess or a prediction. We’ll have to wait and see. These next three graphs kill the climate crisis.
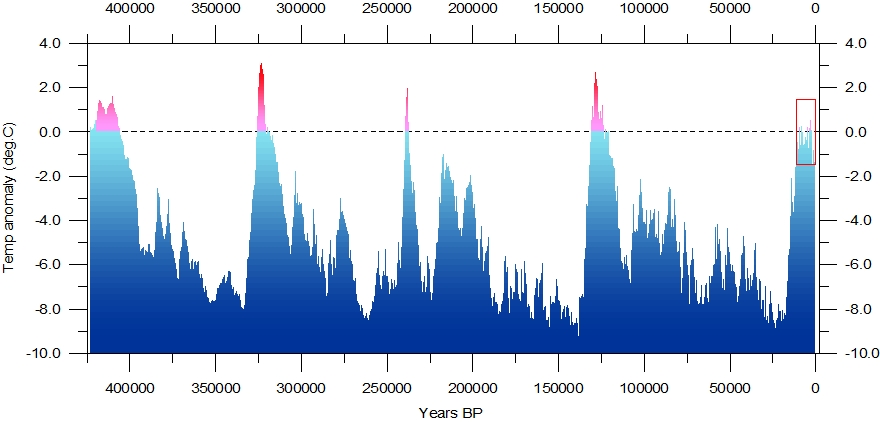
If modern temperatures are unprecedented, past temperatures must be even more unprecedented. From Climate4you (Petit et al., 2001). Click to enlarge.
At right is a reconstruction of Greenland temperatures over the last 420,000 years. You can see the cycle of ice ages and the red temperature peaks of the intervening warm periods and every single one was higher than today. Time goes from left to right and modern temperatures are marked by the red rectangle. In this period, almost half a million years, today’s temperatures are not unprecedented. Yes, a double negative: it means today’s temperatures have occurred many times.
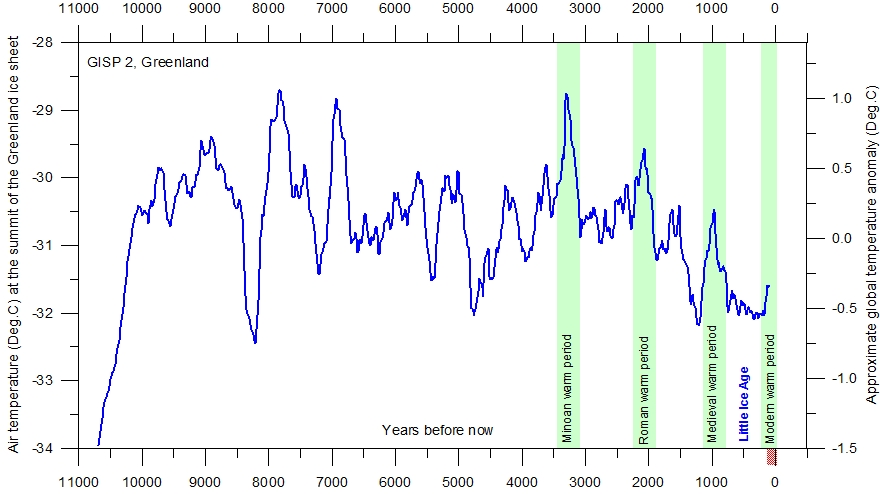
More unprecedented temperatures—in the past. From Climate4you (Alley, R.B., 2000). Click to enlarge.
Now we zoom in on that red rectangle spanning 11,000 years. We’re pretty much near the lowest temperatures in this period. Our recent temperatures, though warmsters describe them as alarming, are well below the peaks of the three well-known warm periods of the last thousand years, known as the Minoan, Roman and Medieval Warm Periods, during which civilisations flourished.
TEMPERATURE FACTS
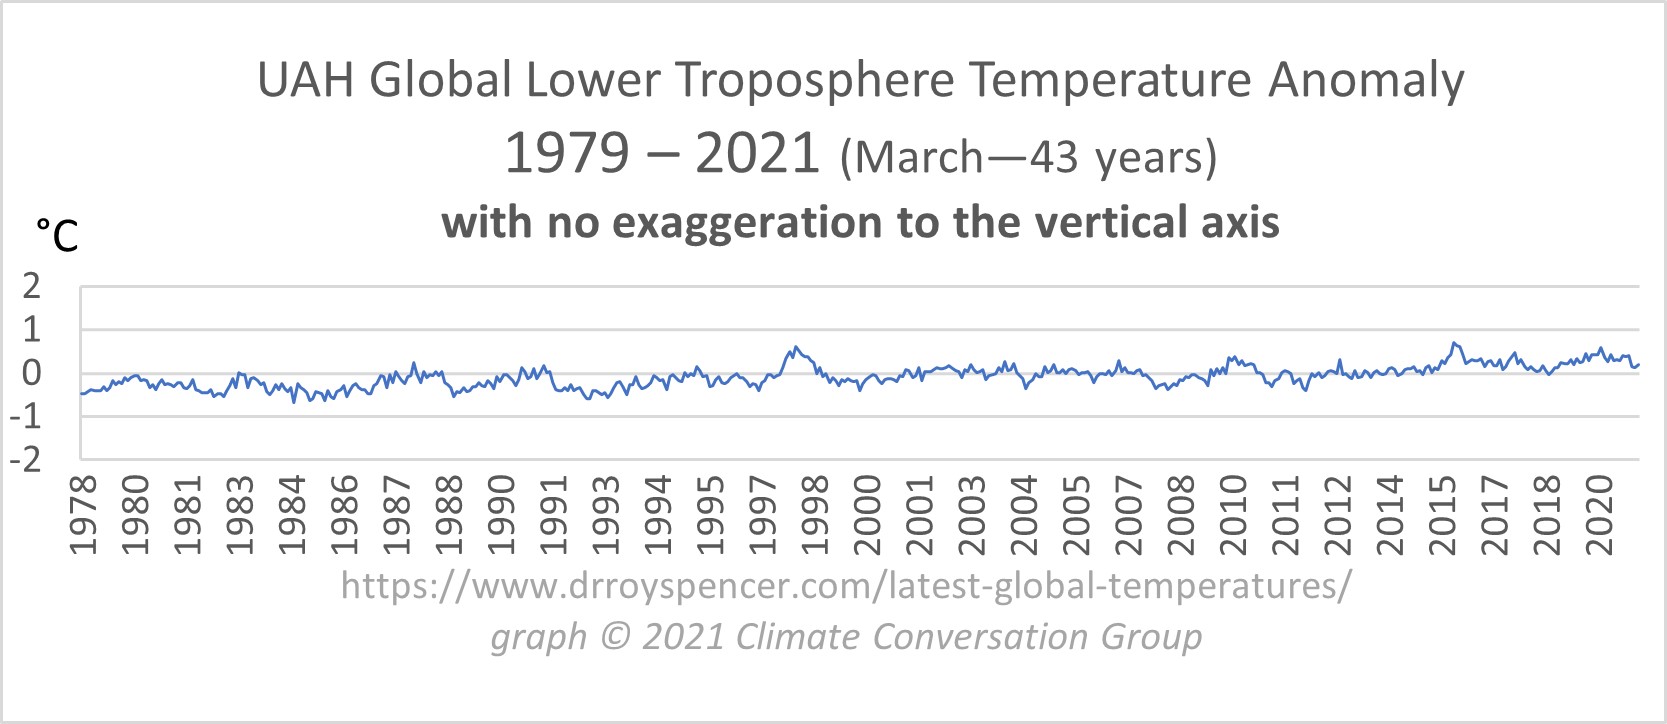
click to enlarge
In the last 43 years, global surface temperatures measured by satellite, when graphed without exaggerating the vertical axis, are completely unalarming:
RAINFALL FACTS
Rainfall
New Zealand rainfall
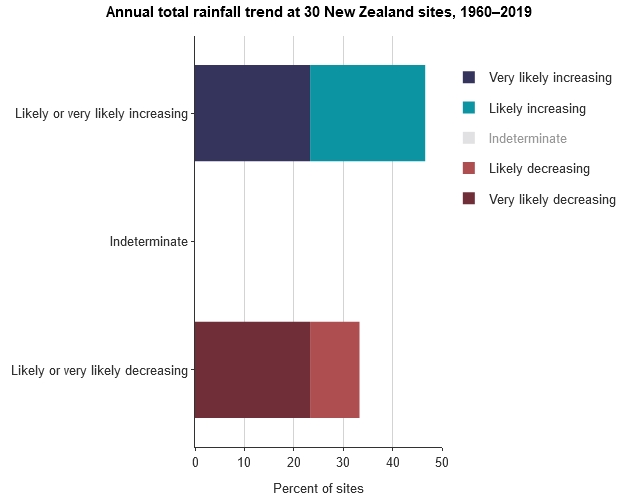
This graph from the Department of Statistics (retrieved 1 July, 2021) shows total NZ rainfall seems well balanced between rising and declining trends, with a substantial group whose trend is neutral. The data would be necessary to confirm a trend, but I regret I can’t see where it is.
The NIWA web page, Past climate variations over New Zealand, gives useful information and graphs on rainfall but shows no evidence of a climate crisis. I’ve found statements associated with NIWA that include the word ‘crisis’ but they’re not official NIWA statements. What their scientists say unequivocally describe a crisis, but they produce no data to support it.
I conclude there’s no crisis, but you decide.
Global rainfall
https://www.cpc.ncep.noaa.gov/products/precip/CWlink/climatology/globalprecip/gprecip.clim.annual_1979-1995.gif
Rainfall fluctuates in all regions on all time scales. Estimates of oceanic rainfall have been possible only since the early 1970s, so accurate long-term estimates won’t be available for many years. The AR5 (IPCC, 2013) has little confidence in precipitation records over land from 1900 to 1950 because of missing data and not much confidence after that—so 20th Century changes are indistinct.
There are always reports of heavy downpours, landslides and flooding after heavy rain, along with occasional droughts, but the data don’t support claims that “it’s raining too much” or “it never rains”. NOAA’s graph of global annual mean rainfall from 1979 to 1995 shows from 0.0 mm/day to 8 mm/day over 17 years:
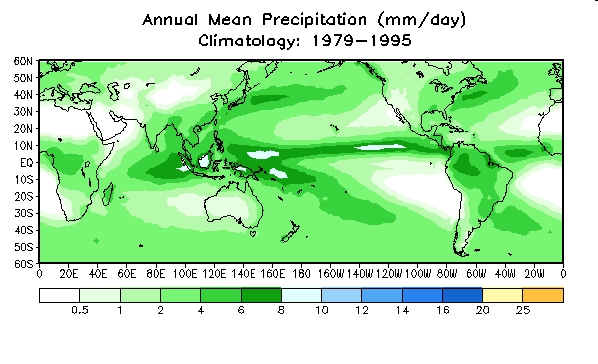 Rain falls regularly everywhere but the known deserts and parts of the major ocean basins, with the heaviest showers in the tropics and at sea.
CLOUDINESS FACTS
Cloudiness
Clouds and their effect on temperature have long been debated. In a recent Russian paper, Cloud Changes in the Period of Global Warming: The Results of the International Satellite Project, Oleg Pokrovsky, 2019, shows that cloudiness declined by 2%—6% over 1983–2009, which hardly seems alarming.
The study found that more low-altitude cloud cover is associated with low global temperatures. A statistical relationship exists between global cloudiness and land air temperature that suggests a 1% increase in low cloud cover corresponds to a global temperature decrease of approximately 0.06 °C and vice versa. Pokrovsky offers an interesting insight:

Fig. 1. Analysis of the series of the total global cloudiness (%) from the ISCCP data: (a) the crosses are the initial data and the curve is the nonlinear trend (the result of smoothing the series by the cubic regression); (b) nonlinear trend (the result of smoothing the series by the nonlinear algorithm) and confidence intervals for the 10% level of significance. Click to enlarge.
These data suggest that the effect of the cloudiness on climate change has so far been underestimated (IPCC, 2007). One reason for this is that climate summaries of the ISCCP data have only recently become available. Another reason is that our knowledge of the mechanisms of cloud formation and evolution is clearly insufficient, and the methods and parameterization used in climate models are inaccurate (see Rossow et al., 2005). The fact that a decrease in cloudiness, first and foremost, over the oceans, is observed simultaneously with the increase in the ocean temperature, which entails increased evaporation from the water surface, requires a critical analysis of the existing views regarding the mechanisms of cloud formation at different latitudes and altitudes. [emphasis added]
So there’s a disparity because observed greater evaporation implies cooling of the water surface, thus more water vapour available to produce clouds, yet cloudiness was observed to decline. Which came first? Which is causing what? More study is needed.
OTHER FACTS
Other elements of weather
Studies suggest prevailing winds will move poleward under the influence of global warming with their velocities unaffected. The remaining weather components of Humidity, Atmospheric pressure and Solar radiation are not problematic, as far as I can tell.
SHARK FACTS
Sometimes, Simon Wilson cedes control of his mind to climate scaremongers. He says:
More people are being attacked by sharks. Worldwide in the 1970s, according to Florida Museum’s International Shark Attack File, there were 157 recorded shark attacks; in the last decade it was 799 [an increase of 400%]. Warmer water means changed patterns of feeding for fish of all kinds and entices more swimmers and surfers into the ocean. Florida is the epicentre of shark attacks, with about a third of all recorded cases in the world.
His numbers are all right (one typo, there were 769 attacks, 2009 to 2020) but attacks are declining, and 2004- 2020 water temperatures, using Argo data, have risen this century in the range of about 0.04°C–0.05°C—perhaps a quarter of a Celsius degree in a century and unlikely to cause much of anything. Wilson’s analysis is also misguided, as the causes of shark attacks appear to be more strongly related to human population growth, their activity in the water and the shark species. The International Shark Attack File (ISAF) reported in 2020:
For decades, Florida has topped global charts in the number of shark bites, and this trend continued in 2020. Florida’s 16 cases represent 48% of the U.S. total and 28% of unprovoked bites worldwide. However, the state saw a significant drop from its most recent five-year annual average of 30 incidents.
They also say that, despite 2020’s spike in fatalities, long-term trends show a decreasing number of annual fatalities. Over the decade 2009 to 2020, there were 769 attacks (Wilson claims 799, no doubt a typo).
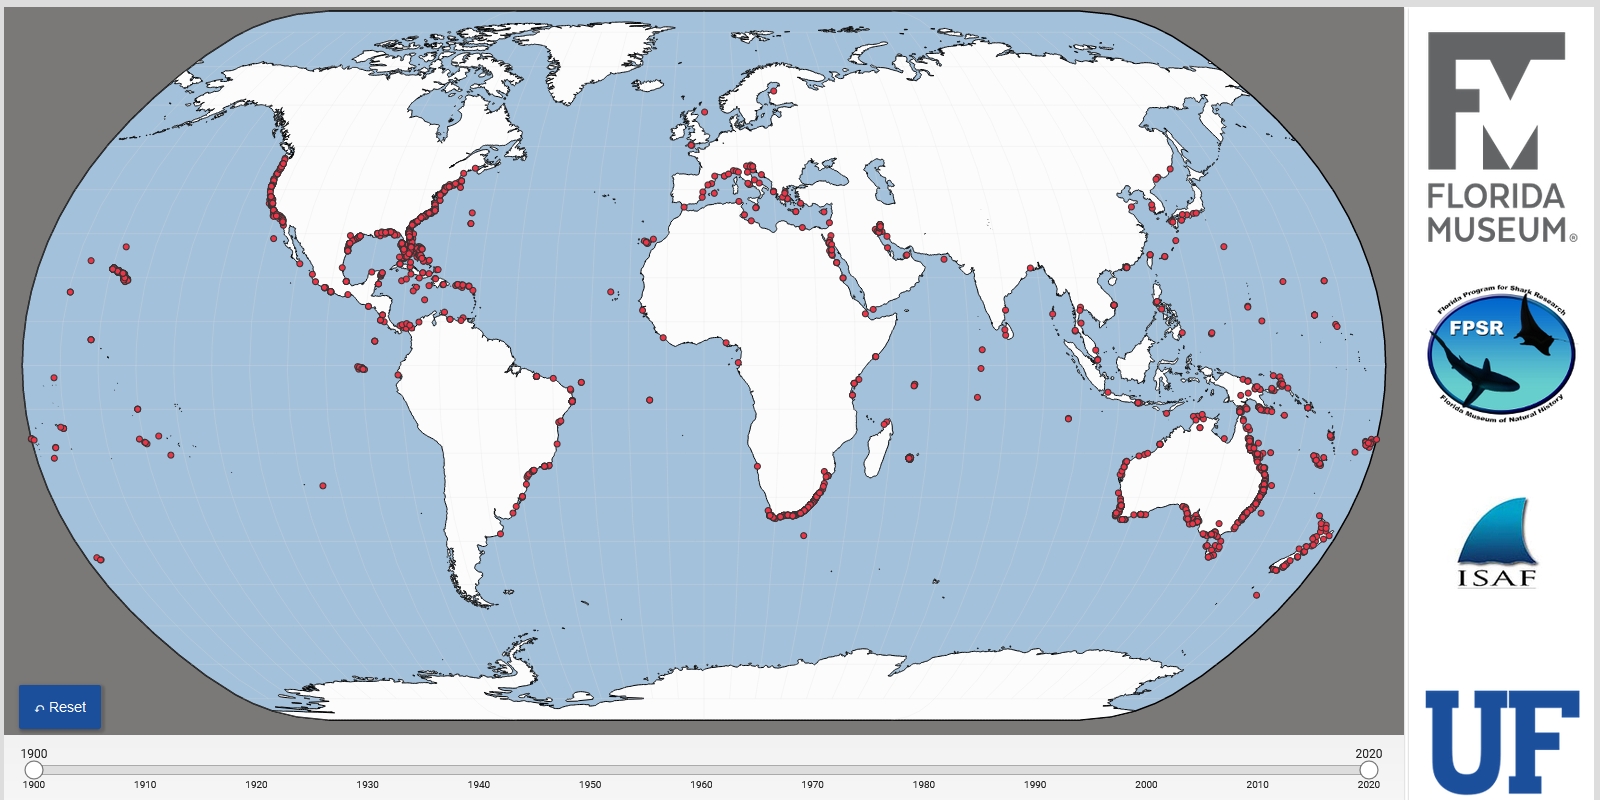
That’s a handy map. I learned of shark attacks in very faraway places. Remember, the attacks are not being caused by climate change. There seem to be four significant facts:
- World population doubled between 1970 and 2020.
- Better roads, affordable vehicles and boats give increased populations ready access to marine activities.
- Better communications mean we learn of faraway shark tragedies where previously we didn’t.
- Sharks’ normal prey have been decimated by over-fishing.
It’s likely that number 1 is a major reason for increased shark attacks.
Shark attacks NOT CAUSED BY GLOBAL WARMING
That’s all for now. I’ll cover more of Simon Wilson’s freaky notions when I get a chance.
NO CLIMATE CRISIS
References
- Exxon, shark attacks and America’s climate crisis
- Petit, J.R., et al., 2001. Vostok Ice Core Data for 420,000 Years. IGBP PAGES/World Data Center for Paleoclimatology Data Contribution Series #2001-076. NOAA/NGDC Paleoclimatology Program, Boulder CO, USA.
- The Younger Dryas cold interval as viewed from central Greenland. Alley, R.B. 2000, Quaternary Science Reviews 19, 213-226.
- https://www.stats.govt.nz/indicators/rainfall (select Grouped) retrieved 2 July 2021.
- https://rogerpielkejr.blogspot.com/2013/10/coverage-of-extreme-events-in-ipcc-ar5.html
- Cloud Changes in the Period of Global Warming: The Results of the International Satellite Project
- Models running too hot (AR5).
Views: 333
I like the idea of Simon Wilson relating shark attacks to climate. It simply shows the desperation of the climate alarmists to find any link, no matter how tenuous. This will become even more prolific as the planet cools and the wheels fall off the climate change band wagon. Well, that is, until they find a way to blame global cooling on carbon dioxide. There is a much stronger correlation between shark attacks and ice cream consumption. Simon Wilson is a clueless half wit who is far too full of his own self importance since winning the reporter of the year accolade. I once remember him guesting on the Heather Du Plessis Allan afternoon radio show and, when it came to climate change, he came across as an arrogant, condescending pillock with no science credentials what so ever. When it comes to climate change Simon Wilson is simply nothing more than the best prostitute in the brothel.
I have just watched a video that must have escaped from the British Royal Society. I say escaped and not released, because it made sense. Essentially, the video was about science getting it wrong and why this isn’t a bad thing. The video goes on to explain certain facets of the scientific method and why we can trust it. Why science works and why it evolves and gets better and closer to the truth over time. The comments in brackets are my thoughts and not part of the video.
– Questioning “established facts” is actually at the heart of the scientific method. (Unless, of course, we are looking at climate change when questioning established facts is just not allowed on pain of excommunication. Clearly, in this aspect, climate change “science” has managed to completely divorce itself from the true scientific method. Scientific fail number one for climate science.)
– There is also the fact that different experts examining the same raw data can reach different conclusions. (Except when it comes to climate science, when different conclusions are just plain not allowed. Scientific fail number two for climate science.)
– Uncertainty in science is not enough if all the perspectives are the same. Sometimes this lack of diversity can skew the results and produce bias. (No more so than in climate science where only one perspective is allowed. Scientific fail number three for climate science.)
Scientists don’t always get it right at the first attempt. But this should give us confidence in the science when old ideas are replaced by new information. (With the notable exception of climate science when any information is allowed only when it supports the old, outdated ideas. Real new information is ignored. Scientific fail number four for climate science.)
Uncertainty is baked in to the scientific method. It is the fundamental reason that progress is possible. (Climate science is certain and settled. Uncertainty is only a figment of imagination for climate change deniers, so doesn’t exist. Therefore climate change science fails to meet the Royal Societies’ definition of the scientific method. Scientific fail number five for climate science.)
Ultimately it comes down to a choice of who you trust more. The person who is certain they are right, or the person who is willing to be proven wrong. (This one just speaks for itself.)
Climate science fails to meet any of these definitions of why science has integrity and why it progresses. By the very definitions laid out by the British Royal Society, we cannot trust climate science, it does not work on any level and is not scientific by its nature, or in its methods.