
Hauraki Gulf islands. Looking much the same after more than a hundred years.
UPDATED 11:30 am 26 June 2021
Dramatic sea level rise is widely considered among the most evil effects of anthropogenic global warming, since warmsters claim that of all the posited effects, rising seas will cause the most widespread, disruptive and costly damage. We’ve seen that the recent alarming advice from the MfE to local bodies around New Zealand cites figures from RCP8.5, the most extreme of the scenarios the warmsters paint for our future, and although there are enormous differences in both the likelihood and levels of danger between RCP8.5 and observed reality, our news media never seem to hear that part and publish only the anxiety.
This site exists to provide a balanced view of fearful warmster exaggerations and unfounded forecasts.
Paul Homewood showed a week or so ago that a recent North American study found a substantial increase in the rate of sea level rise where none exists. In fact, the rate of sea level rise on the North American eastern seaboard throughout the 20th Century displayed little variation around a non-startling trend. Vertical movement of sea level varies considerably around the world in both direction (up and down) and rate, so Dr Willem de Lange, of the Earth Sciences Programme of the University of Waikato, was asked about the New Zealand situation. He kindly brought the latest Auckland data to the table, bringing the 20th Century record right up to date and presenting no cause for anxiety.
He’s often told me there’s more chance of substantial sea level change from an earthquake, such as the recent Kaikoura shake that shoved the land upwards by about five metres in seconds. We ought to be thinking what we’ll do about that, not perspiring about a few extra millimetres per century caused by hypothetical atmospheric warming.
What are the facts?
Willem (we’re lucky to have him) today sends the following email:
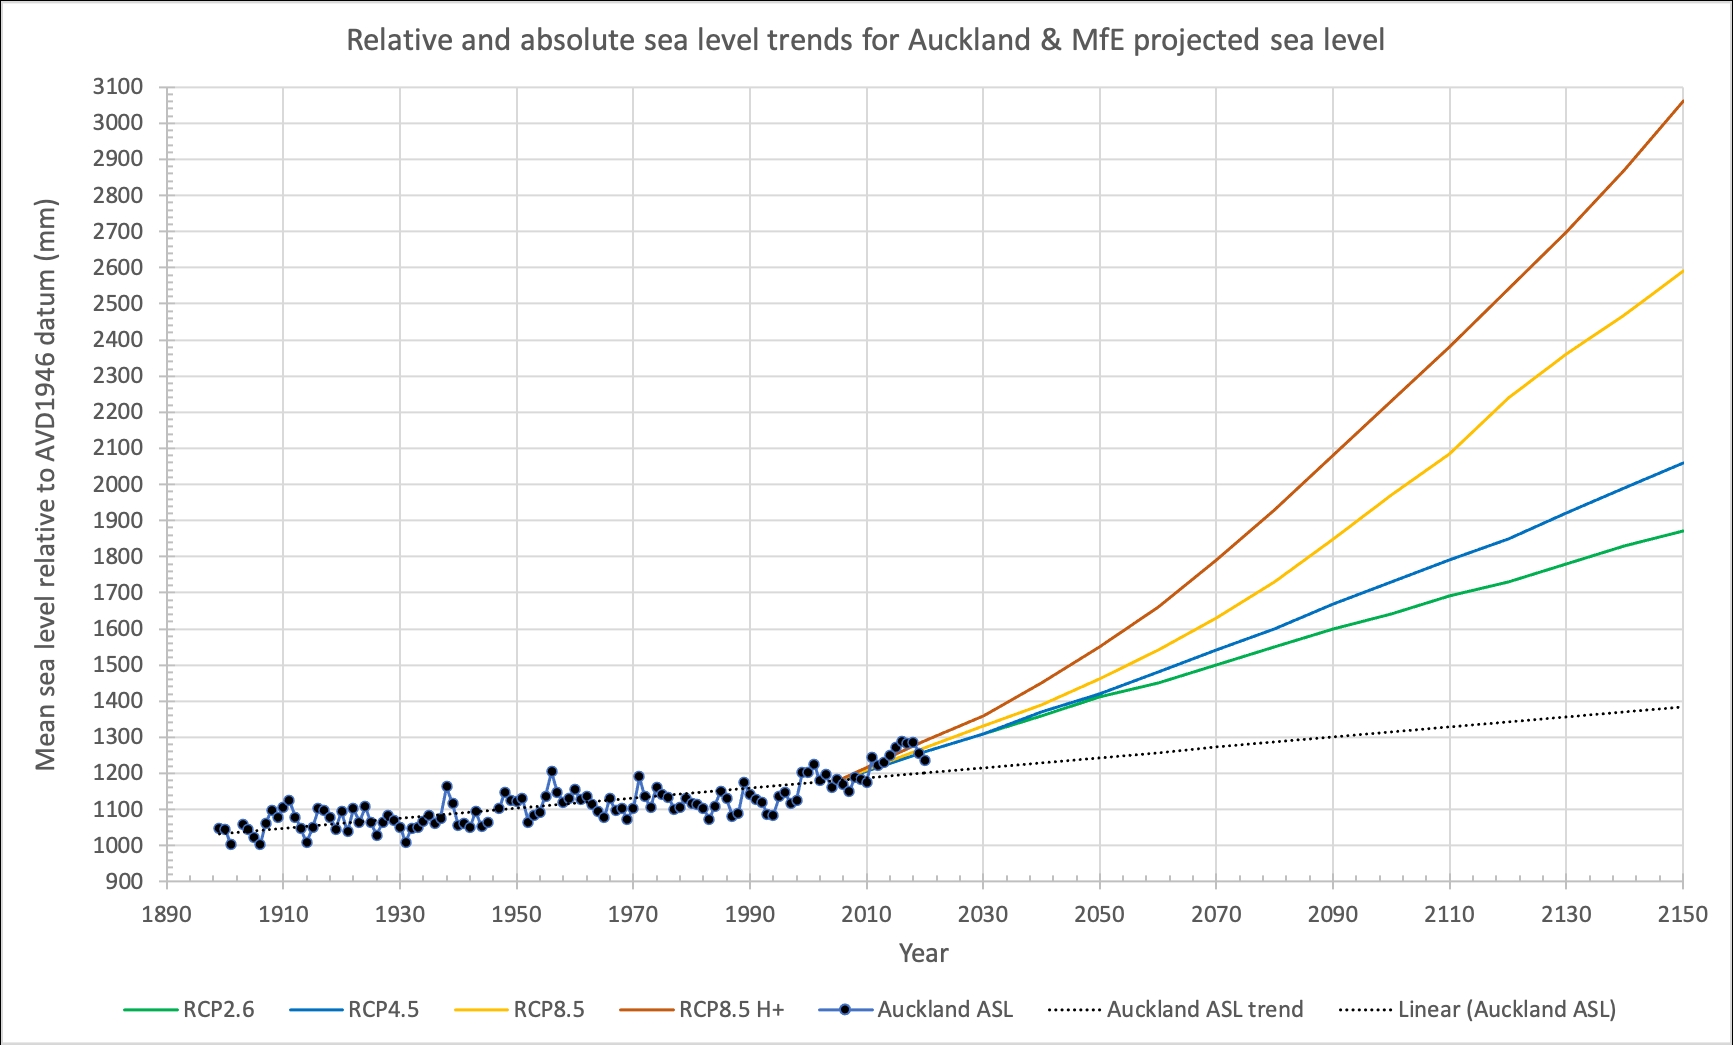
The following plot is the absolute sea level rise for Auckland for 1898 to 2020. The average rate of rise is 1.41 mm/y as determined by Denys et al (2020). They examined the trends for 5 NZ ports, producing a range of 1.21-1.64 mm/y with a mean of 1.45 mm/y. Auckland is considered to be the most representative of overall conditions. Note that contrary to the assumptions by MfE, the absolute rate of sea level rise for NZ determined at the coast is less than 50% of the satellite estimates (3-3.2 mm/y).
The projected sea levels are from Coastal Hazards and Climate Change: Guidance for Local Government (MfE 2017) Table 10, page 106. These are less extreme than those in Table 11 and Figure 27 in that report (Figure 27 is commonly used to illustrate how catastrophic sea level rise could be). The Table 10 projections have been adjusted to match the long-term trend of observations in 2005 (start year for CMIP5 projections).
I extended the historic absolute sea level trend for comparison purposes. Note that my analyses and those of Denys et al. (2020) have shown no evidence of an acceleration in the rate of sea level rise. There is a roughly 60-year cycle superimposed on the long-term trend, so there will be multi-decadal periods where the observed sea level rise tends to be either above or below the long-term trend. Since about 1998 the tendency has been to be above the trend. This decade it is likely that the rate of sea level rise will fall below the long-term trend. It is exceptionally unlikely that the RCP8.5 projections will be reached. The latest IPCC assessment specifically rejected the methodology used to create the RCP8.5 H+ scenario plotted here.
Click to enlarge
Let us know your thoughts in comments below and I’d like to hear alarming views you encounter from other commentators on sea level rise and likely effects on New Zealand society.
Cherry-picking for the best impression
The MfE guidance note suggests that the start point for their projections is the mean of the twenty-year-long 1986-2005 period. This is an unusual way of dealing with model projections, but rife in climate science. In this case the MfE datum would be 1146 mm, not 1181 mm, and would move the projections down by 35 mm. The only effect this really has is to give the impression that the projections are a better fit.
Alternatively, we could follow climatological methodology and base it on the 30-year normal period of 1991-2020, which is centred on 2005. This would be a datum of 1191, shift the projections up by 10 mm (not as much as the 1985 starting point because sea level hasn’t done much over the last 30 years despite the claims of our Minister of Climate) but it would make the projections look a bit worse.
Regarding the extreme RCP8.5 H+ scenario
The methodology of Kopp and others was used by NIWA to create RCP8.5 H+ when Kopp was visiting them on sabbatical. The IPCC Special Report on Oceans and Cryosphere in a Changing Climate (SROCC, 2019) indicated the methodology was invalid. Kopp applies probabilistic methods to the RCP scenario results (ignoring their underlying probabilities and uncertainties) that amplify the extreme upper tails of the distributions. In other words he takes the worst case situations, makes them even more unrealistic, and disguises it with statistical waffle. As Judith Curry noted in a review of a Kopp co-authored sea level assessment for New Jersey, his approach even manages to make the RCP2.5 scenario look catastrophic.
Note that Robert Kopp is lead author for Chapter 9 in AR6.
RCP8.5 H+ in New Zealand
The Tauranga City Council website includes information about the super scenario RCP8.5 H+ as follows.
The projections for sea level rise around New Zealand, based on the different scenarios, vary between 0.23m and 0.37m in 2050, and 0.46m and 1.05m by 2100 as outlined in the guidance from the Ministry for the Environment on coastal hazards and climate change.
The projections for NZ and Tauranga include a fifth scenario in addition to IPCC’s four: H+. The H+ scenario reflects the possibility of future surprises, where more rapid rates of sea level rise could occur early next century.
As the graph shows, the H+ influence soars way above the regular RCP8.5 scenario, itself already far above the vaguely-reasonable and hardly possible RCP6.0. Note the observed trend, as shown in Willem’s first graph, above, is presently tracking well below RCP2.6. The real sea level hasn’t started to accelerate yet, and it’s already 2021—only 79 years to go! Better get cracking, eh?
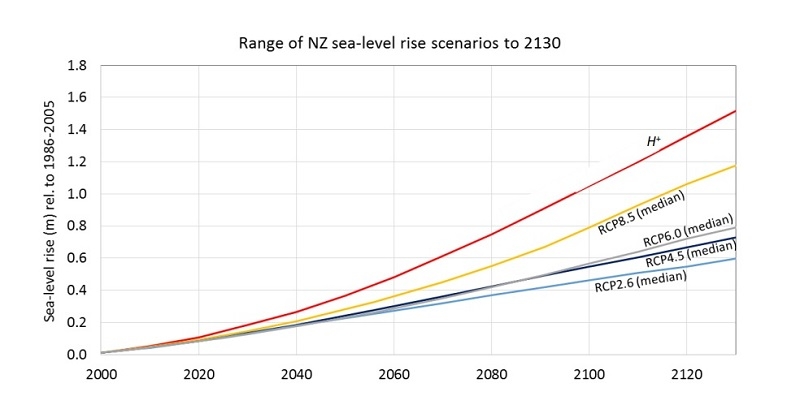
RCP8.5 H+ — the super-scenario to rule them all.
Surprise!
The idea of a future surprise is surprising. This comes from scientists? They’ve outdone themselves. Those NIWA bozos have managed to increase an already outlandish projection of future warming, and they’ve done it by using a methodology the IPCC itself decided was invalid. Marvellous.
Especially for Tauranga City Council
They’ve actually done it by not doing it. In other words, they’ve said it won’t happen, but it’ll be a surprise, so we should let you know, or we wouldn’t be scientists, would we? Yes, we’ll let you in on all our guesses, suspicions and fancies—everything we see in these chicken entrails.
Shonky? Hogwash? Baloney, tripe, drivel, bilge, bosh? You decide. I’ll let the Tauranga City Council know exactly how they’ve been deceived by our “scientists”.
References
- Sea Level Rise in New Zealand: The Effect of Vertical Land Motion on Century-Long Tide Gauge Records in a Tectonically Active Region, Denys et al. (2020) Journal of Geophysical Research: Solid Earth, Vol 125, Issue 1
- Coastal hazards and climate change: Guidance for local government (pdf, 12 MB)
Views: 528
The most recent Stats NZ data ( to 2019) for tide gauge measurements supports the Denys data. But there is now satellite measurement which began in the early 1990’s, so there are now two modalities of measurement.
All the ‘official’ bodies now quote only the satellite data, which is in fact twice as high a change as the tide gauge data – 1.6mm p/yr versus – satellite 3.5mm p/yr or more for global avge. This of course suits the general AGW and alarming future rise claims.
Why the difference? No one has explained, or even talks about it.
I once saw someone suggest that the sat. measure was affected by the effect on the sat. radar beaming caused by the fluid-to-air surface evaporation change at surface level.
So, in those 30 or so years since inception, satellite rise has shown 30 x 3.5 mm rise. But tide gauge has shown only 30 x 1.6 mm rise. That’s a difference of some 45mm not reflected by tide gauge.
Surely the tide gauge at the actual land/sea interface must be the more accurate?
Why is there no discussion about this?
All our usual NZ ‘experts’ just quote sat. data and ignore the StatsNZ data.
Hi Nick. Thanks for your comments. The only explanation I’ve heard for this discrepancy blames a mathematical error in the shape of the geoid that underlies our description of the sphere of the earth, which isn’t properly round. Still, until the discrepancy is ironed out, we know this without doubt: tide gauges measure sea level close to land and there’s no dispute over what they measure. Their accuracy is clearly superior to the satellites, which apparently measure rising trends about twice those of tide gauges. Using satellite measurements in the face of this knowledge is simply stupid, but of course the warmsters do so in order to ramp up the anxiety and sense of urgency.
You’re not quite correct when you say all our NZ experts quote satellite data. This very post publishes a statement from Dr Willem de Lange (very much a Kiwi expert), who gives the long-term Auckland tide gauge record as 1.41 mm/yr and says the mean of the trends at five New Zealand ports is 1.45 mm/yr.
The problem with trying to measure sea level is what do you use for a reference. Using tide gauges seems to be a good starting point, but that assumes that the land is stable. This is not always true, particularly in New Zealand where we are definitely not geologically stable. Even where we consider the land to be a reasonably good reference, places like the UK for instance that are not prone to large geological movement, there are examples such as Sandwich in Kent. This was one of the historically important Cinque Ports, but is now 2 miles inland (umm, sea level rise?). There was a port in the Caribbean, I will try and dig out its name. It was an important bolt hole for pirates but is now 4 kms in land. Yet we see photographs going back to 1885 of Fort Denison in Sydney Harbour. When compared to modern photographs there is no sea level rise at all. So I think we have to be careful when looking at tide gauges, albeit that they will give us far better data than satellites.
There was a post sometime back about satellite data and the problems in obtaining accurate measurements. If I remember correctly, raw satellite data before 2004 seemed to show no sea level rise. Envisat appeared to show a sea level fall between 2002 and 2004. According to Nils-Axel Mörner (sadly no longer with us) this data changed in 2005 and was “adjusted” when it suddenly showed a sea level rise. The “adjustment” was to take in to account an average global rise in land levels. Go figure. We can’t measure sea level rise accurately because the land is rising faster. Who knew.
There were also a technical references to the types of radar bands used in these satellites clearly showing the radar frequencies, including resolution. What it did show was that these instruments are actually not capable of accurately measuring sea level rise at current rates.
I think the most telling figures came from the Jason 1 and Jason 2 satellites. They both use exactly the same design of altimeter, but they disagree by around 7.5 centimeters. They were designed to measure their altitude to sea level within a few centimetres. Clearly with an accuracy no better than 7.5 centimetres at best. So, how can 2 instruments, both with a stated resolution of a few centimetres, that don’t agree with each other, accurately measure a change of sea level in fractions of a millimetre? What ever these guys are taking, I want some.
Ok, interesting comments. I think you should reverse yourself (get it?) off your esradral and do some research, mate.
As I say, nobody seems to know why the satellites are shot. You describe valid problems with tide gauges and open by asking for a reference point. Willem’s first sentence gives it: “The following plot is the absolute sea level rise for Auckland for 1898 to 2020.” By absolute he means combining vertical land and sea movements. The tide gauge is hooked up to a GPS system. This has been done for years, to solve the problems you describe.
As I say, it doesn’t matter why the satellite altimeters are wrong, tide gauges are self-evidently accurate. If you glance through Denys et al. at the reference I give, you’ll see it describes the use of GPS:
Well spotted Richard :). However, I do have a problem with the accuracy of GPS to measure vertical movement. Whilst horizontal movement, by comparison, is simple, vertical movement is still relative to the satellite and its altitude. I was always under the impression that GPS vertical accuracy was, at best , 2 to 3 times less accurate than horizontal accuracy and could be as far out as +/- 0.7 metres. I also thought GPS used the L band microwave frequency with a wave length of between 15 and 30 cm. I will take your advice and get of my lard arse 😉 and do some more digging.
Thanks Richard. More information the better.
Ok. I didn’t know about a difference between horizontal and vertical measurements. Interesting. Look forward to your next report.
Thanks Richard, for your supportive comments.
I should clarify that I was not aiming at de Lange in my remark about local ‘experts’. I meant him no disrespect.The italics were used as a dig at those who appear frequently in climate items that appear in our press and sadly, who are on official bodies and organisations, warning us of impending climate doom.
The VLM issue is of interest to us here, since the length of NZ straddles two continental plates, with one end of the country rising above, and the other sliding below , but ever so slowly in our lives.
Also, I understand that the NZ land mass is slowly moving towards Australia.
Now that is a real worry!
Yeah, good comments, Nick, thanks. I’m not sure that we’ve reversed our escape from Australia, but I hope it’s not verified. Let us know.
O.K.;
will add my ignorance here:
GPS in land surveying I thought to include land-based stations as temporary reference points. Somehow the satellites are used to confirm the position of the land based station ( several hours of interpolated positioning using multiple sats…? ) then the land station is able to deliver sub-millimetre accuracy for the elevations (and distances) out to the functional distance of the lasers used by the ground crew ( several kilometres may be a couple of millimetres +/- vertical . When I (helped with) river-level measurements for a couple of years, we would close a circuit within a couple of vertical millimetres back to the benchmark…….or do it all again with the Dumpy on a section of a couple hundred metres. Real surveyors were already using lasers and GPS for similar results over several tens of kilometres back then in the ’80s.
I am presuming that the tide guages mentioned here are surveyed back to the NZ geo. survey benchmarks and the NZ benchmark grid is routinely updated for all sorts of movements.
Vaguely recall a story of the NZ survey teams connecting the East Cape Circuit……back in the ’50s with Dumpy type levels; and being frustrated at about some two inches of mis-close after two hundred miles of work, over several months.
Then they concluded it was evidence of the land itself in vertical movement.
A real surveyor would be better to comment, of course.
I would put my money on the land-based tide guages, as long as I could see the reasoning behind each of the adjustment factors added to the raw record. Every factor should have a chain of evidence attached to it.
When the raw measurements are hidden and “the record of adjustment” is “lost”; then all sorts of mischief can be reasonably inferred to those who have been entrusted with the measurements and reporting.
Just say’n.
Ciao, Walnutter
Oh dear,
I am sorry to have to report that our faith in our Stats.NZ and Min Environment land gauge readings are very astray.
Check this item below on Stuff website yesterday 28 Jun.
Have not sourced the original publication in Nature and I await appraisal by
someone better qualified than I.
https://www.stuff.co.nz/environment/climate-news/125584384/study-finds-lyttelton-sea-levels-rising-faster-than-thought
Never mind Nick. Between Stuff and Env.NZ,s biases and several Earthquakes; I would trust Willem every time! Having met and discussed scientific indeed Coastal matters with him. No BS there!! Brett Keane
AND MODELS CAN NEVER VALIDATE ANYTHING, ESPECIALLY IN THE FUTURE! WHAT A LOAD OF COBBLERS FROM THEM, NICK.
Forgive my ignorance on the topic of measuring sea levels, I am struggling with how one can accurately measure a sea level rise of eg 1 or 4mm & say with any degree of confidence that it is due to AGW or is due to natural rises (& or falls) due to air pressure differences? The Oceans are massive covering around 70% of the Earth’s surface & a huge amount of fresh water flows into these oceans all of the time from many rivers! as an example, the effects of fresh water from the Amazon alone are seen in the Atlantic Ocean for something like 200miles into sea from the mouth of the river!!
So how can one accurately predict any increase in sea levels is either due to the volume of fresh water entering the sea or is due to global warming, air pressure variations or any other phenomena? It would seem, though, nature has the re-cycling of water (as rain) pretty much under control!
Sea levels vary from day to day and week to week, depending on the weather situation. Air pressure variations has a direct influence on the movement of sea levels, but of course the AGW alarmists would be ignorant of these facts. I read somewhere, that a high air pressure sitting over the sea, has a lower sea level of approx. 1 cm directly under the high pressure, but increases are noted of similar amounts on the outsides of said high pressure. That means, high air pressure over a sea area corresponds to a lower sea level and conversely low air pressure (a depression) results in higher sea levels. This is called the inverse barometer effect & depending on where the centre of the air pressure is sitting at the time will influence the accuracy of the measurements of the sea level when they are taken.
For example, sea levels in north-western Europe are often high during the frequent autumn and winter when there are depressions and strong westerly winds, but low during the spring and summer when high pressure and gentle winds dominate.
Maybe someone with more knowledge of this topic than I would like to comment please?
Juglans Nigra
I was a ‘chainman’ and later an ‘Instrument Man’ for the survey office of the MWD based in Palmerston North. We used the old style lasers powered by truck batteries back in the late 70’s & into the 80’s. The longest distance we measured was around 8 km for the work that we did.
A friend of mine however was a chainman for the Lands & Survey dept. in the early 1980’s. He told me of a series of observations they did whilst set up at Trig B1CT (544m a.s.l.) called Tarakamuku, the highest point along North Range Rd between the Manawatu Gorge & the Pahiatua Track. That trig is surrounded by wind turbines unsurprisingly these days. Their job was to firstly set up a large array of prismatic reflectors for another survey party in the vicinity of Ohakune to aim their laser at.
At Tarakamuku they too were armed with a similar very large laser. I don’t recall the exact trig at Ohakune, but I am guessing that it was either A7WM (672m) or A7WV (692m). The mean distance is around 216km. Their results were being used to monitor uplift of the central plateau from the supposedly more stable northern Tararuas.
From the graph there does seem to be a slight increase in the rate of rise at about 2000. This is about the time when the Akl gauge stopped being reported to the international PSMSL database (https://www.psmsl.org/). I wonder was the gauge was moved or a new type installed? It’s a pity as other NZ sites such as Dunedin and Wellington continue to have their data available through PSMSL and show no increase in the rate at about 2000. Maybe I’m too suspicious but I wonder if there’s not some PC fiddling (or adjustment) going on here…
Does anyone know why there was a change in both their reporting and rate of SL increase at about 2000?
I’ll ask Willem.