
For each year since 2000, Bryan Leyland has assembled a graph of the global temperature against the Southern Oscillation Index (SOI), shifted forward by four months. The result is a remarkable correlation that gives an excellent indication of global temperatures up to four months in advance.
Here’s Bryan’s graph for 2021:
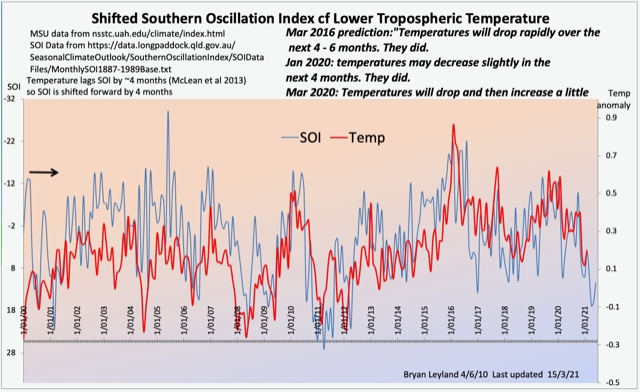
See more details at Bryan’s website.
Views: 316
Note that Bryan is plotting tropospheric rather than surface temperature. The troposphere is more sensitive to ENSO than the surface. Note also the overall warming trend which is not explainable by ENSO.
Indeed, Bryan shows the LT temperature record, following NASA’s acknowledgement that the satellite observations are the most accurate available. Importantly, the satellite coverage of Lower Tropospheric temperature is greatly superior to the patchy land surface coverage and unimaginably sparse ocean coverage by thermometers. It includes remote deserts, mountain ranges, vast wetlands and of course the entirety of inaccessible oceans, and gives us an excellent impression of temperature trends over 40+ years. All that matters in this climate debate is the trend, so we want to know it to good accuracy. Also, the troposphere includes the surface.
The idea that the troposphere to about 11,000 metres is somehow “more sensitive” to ENSO than the surface when the influence of ENSO on temperature begins at the surface is puzzling. Please explain that.
Yes, we note the small warming trend (I wouldn’t call it an overall trend, with that constant variability) between about 2000 and 2002, then about 2014 to 2018, although it has just returned to zero and who knows what it will do next? Would you like to explain that trend?
Good graph
Not sure if I sent you this one…. Using very thin Walls to eliminate the container effect.
///C:/Users/HP/Documents/Climate/Data%20and%20Experiments/Expts/Mylar%20baloon%20BERTHOLD-KLEIN%20(2).pdf
Confirms Maxwells work. NO Greenhouse effect. Happy Easter to all. Brett Keane
This is damned inconvenient. So how long before Mann removes the Southern Oscillation Index in the same way he has removed the Atlantic Multidecadal Oscillations? In his latest paper he cancels the AMO as an artifact of climate forcing. What’s the betting on him turning his attention to the SOI next.
https://notrickszone.com/2021/04/01/physicists-lab-experiment-shows-a-co2-increase-from-0-04-to-100-leads-to-no-observable-warming/
This is the correct answer from my own work but more importantly that of Maxwell and all atmospheric Gas Physicists. They understand clearly how and why the Ideal Gas Laws distribute energy and buoyancy while obeying the Planck/Einstein Quantum functions.
The fabricators of CAGW were not Physicists, but Geographers and Mathematicians. Which should be obvious. Brett Keane