
• Guest post •
— by Barry Brill, Chairman of the New Zealand Climate Science Coalition
This note offers brief replies to specific aspects of a Comment by NIWA scientists (called hereafter “NIWA Comment”), published in Environmental Modeling & Assessment in April, 2018, concerning A Reanalysis of Long-Term Surface Air Temperature Trends in New Zealand (by de Freitas et al., 2015) (“de Freitas”).
-
Abstract
Since there was a systematic tendency for the seven-station sites to be relocated to colder locations as the early half of the twentieth century progressed, [de Freitas’s alleged] rejection of valid adjustments produces an artificially low rate of warming.
Reply
The NIWA Comment is mistaken. No system of decision-making caused weather stations to be relocated to ever-colder sites throughout the early twentieth century. It is immediately obvious from a perusal of the site maps set out in the Mullan Report (2010) (Mullan Report) on NIWA’s website, that the 38 recorded relocations of 7SS stations were wholly random, and there is no discernible pattern to the movements between mid-town, rural and suburban sitings. See, for example, pages 66 (Wellington) and 158 (Dunedin) of that report.
-
History
The NIWA Comment outlines the history of the 7SS from its inception in Salinger’s unpublished 1981 thesis (S81) to its re-calculation as a NIWA project (the Mullan Report) 30 years later.
Reply
In 2010, concerns were raised in the New Zealand Parliament that the warming trend of 0.9°C/century derived1 from the now-obsolete S81 could not be replicated using modern RS93 techniques. The Science Minister undertook that NIWA would re-calculate the 7SS adjustments and publish its detailed methodology in a peer-reviewed international journal by June 2011. While this NIWA work (Mullan Report) was posted on its website the promised journal publication was first deferred to June 2012, and subsequently to June 2013. It has never appeared. Although the Mullan Report was the subject of a critical report by the Australian Bureau of Meteorology (BoM), those criticisms have never been disclosed2.
-
Other temperature records
“[de Freitas’s result is] very much at odds with all other published evidence (e.g., AR5 WG1 Fig. SPM.1).”
Reply
The de Freitas warming trend of 0.28°C/century is wholly consistent with the synchronous Southern Hemisphere trend reported in IPPC’s AR5. Both the IPCC and NIWA have long reported that anthropogenic warming trends in ocean-dominated New Zealand would be materially lower than global averages. The S81/Mullan Report trend of 0.91°C/century is clearly anomalous.
Official New Zealand temperature records for eight years in the 1860s, which are both reliable and area-representative, show the absolute mean temperature was then 13.1°C. A 30-year government record for the period ending 1919 shows the mean temperature to be 12.8°C. The current normal (30-year) mean 7SS temperature is 12.9°C. Clearly, New Zealand mean temperatures have remained almost perfectly stable during the past 150 years.
-
Use of RS93
The literature contradicts the claim that de Freitas is the first to publish New Zealand temperature trends derived by the RS93.
Reply
The Mullan Report (along with other NIWA articles that are not publicly available) does purport to use RS93 comparison techniques, so this assertion is naturally accepted whenever these ‘grey’ papers are mentioned in the peer-reviewed literature. However, the Mullan Report sits outside the literature and clearly fails to execute its stated intention to apply RS93 methods. The de Freitas paper rectifies those omissions.
A methodological comparison is set out below:
Table 1: Summary of statistical methods compared
| RS93 | Mullan Report | de Freitas | |
| Data | Monthly | Annual | Monthly |
| Intervals before/after the shift | Symmetric | Asymmetric | Symmetric |
| Comparison intervals (K1 = 1 year) |
K1 & K2 intervals | Varying periods (up to 11 years) | K1 & K2 intervals |
| Significance checking of proposed adjustment | Weighted averages based on correlation | No significance checks at all | Weighted averages based on correlation |
-
NZ Glaciers
The NIWA Comment relies upon the reported retreat of Southern Alps glaciers during a 100-year period beginning in 1890.
Reply
In this area, the most recent authority is Mackintosh et al. (2017), entitled “Regional cooling caused recent New Zealand glacier advances in a period of global warming.” After observing that at least 58 Southern Alps glaciers advanced during the period 1983-2008, the abstract notes:
“Here we show that the glacier advance phase resulted predominantly from discrete periods of reduced air temperature, rather than increased precipitation. The lower temperatures were associated with anomalous southerly winds and low sea surface temperature in the Tasman Sea region. These conditions result from variability in the structure of the extratropical atmospheric circulation over the South Pacific.”
This Nature paper, of which James Renwick was an author, notes that the World Glacier Monitoring Service database shows that in 2005 “15 of the 26 advancing glaciers observed worldwide were in New Zealand.”
-
The 11SS
The temperature trend from eleven other stations with no homogenization was 1.0°C for 1931–2008.
Reply
The background to this ‘independent’ Salinger dataset is set out in this 2010 article, which shows that the 11 stations displayed a mean warming trend of 0.28°C/century during the 40 years (not the implied 77 years) in which they operated. An increased trend value is obtained only if selectively chosen data is added from a minority of the stations.
As is clear from the referenced article, the 1932-54 portion of this dataset has no scientific value whatever. When properly confined to the period when less than 20% of the data is missing, it corroborates the trend found in de Freitas.
-
Pacific SST Trends
The NIWA Comment argues that a reconstruction of early twentieth century records of sea surface temperatures in the south-west Pacific region suggests aggregated mean warming trends in excess of 0.5°C/century.
Reply
This opinion is based on a private communication to the NIWA Comment authors from a Mr Kennedy of the UK Met Office Hadley Centre, which we are unable to assess. Reliance is also placed on Folland & Salinger (1995) which admitted to error bars of 2.0°C/century while estimating a SST trend of less than 0.7°C/century during a period commencing in 1871. Little is added by these references.
-
BEST data
Using up to 52 auto-adjusted datasets1, the Berkeley Earth group derives an absolute New Zealand temperature range of 9.5°C to 11°C over the 160-year period from 1853 to 2013.
Reply
The mid-point of this range is very far from the mid-point of the 12.3°C to 13.2°C range recorded in the 7SS (whether raw or adjusted) and is clearly wrong. Nonetheless, for the 100-year period 1909-2008, the BEST adjusted anomalies are said to show a 100% perfect correlation with those of the Mullan Report (to three decimal points). The claimed independence of such an immaculate outcome is entirely implausible.
-
Anthropogenic warming
During 1960-90, following the advent of anthropogenic warming, the Berkeley figures show cooling in both the Southern Hemisphere (by 14.2%) and the Oceania region (by 53%) while the New Zealand land mass improbably warmed by an extraordinary 148%. The Mullan Report’s adjusted New Zealand data is fully correlated.
Reply
The Mullan Report’s 1960-90 upwards spike could not have occurred whilst the south-west Pacific region was in a cooling phase – which is confirmed by Mackintosh et al. (2017). Further, the final 30-year period of the Mullan Report shows an insignificant trend of only 0.12°C/century, demonstrating that New Zealand has not yet been affected by global warming trends.
Conclusions
de Freitas finds that New Zealand has experienced an insignificant warming trend of 0.28°C/century during 1909-2008. Using the same data, the Mullan Report calculates that trend at 0.91°C/century. Both studies claim to apply the statistical technique described in RS93, and each alleges that the other has departed from that methodology. This core issue has been described in the table above but has not been addressed in this note.
A second core issue relates to reliance upon inhomogeneous Auckland and Wellington data despite the extensive contamination of both sites by sheltering and UHI. That matter has not been addressed here either.
Instead, this limited reply deals with the raft of peripheral allegations contained in the NIWA Comment. In particular, it sets out to show that all plausible published records, as well as the scientific literature, support the view that New Zealand’s temperature record has remained remarkably stable over the past century or so.
1. Using calculations lost in a 1993 computer mishap.↩
2. Despite multi-year appeals under Freedom of Information laws in both countries.↩
3. Mainly stations discarded in S81 as being unreliable or having excessive missing data. As New Zealand’s aggregated raw data shows zero warming, this wide range must have been induced by BEST’s undisclosed adjustments.↩
Views: 1634
Pingback: New Zealand Warming Disputed | Science Matters
Since there was a systematic tendency for the seven-station sites to be relocated to colder locations as the early half of the twentieth century progressed,
Talk about lousy experimental design.
The first thing any experimental scientist should do is minimise sources of error.
Were there no sites available in NZ without such a history of moves or instrument changes in the first half of the twentieth century?
It really is time to biff this charade of adjustments to a poorly conceived temperature record.
Maggy,
I agree, and I get where you’re coming from, but it’s worse than that, since the sites were not moved systematically. They’re flat wrong. Or have I misunderstood you?
I suspect I am not the only one thinking hard on how to take apart the NIWA etc. efforts to falsify the records we paid for…… Brett
Yes. Well, we could try an application for judicial review… oh, wait…
No, actually, our best recourse is just to present the science we’ve found and publish it, as we’ve just done, with the result that we (the NZ Climate Science Coalition, which means the public of New Zealand) now “own” the science behind the national temperature record, given that science is determined only by what is peer reviewed and published. NIWA have published nothing. Even Salinger’s thesis in 1981 wasn’t published in a journal. Some of the errors we’ve found in this latest “NIWA Comment” on our paper consist of nothing more than poor reasoning (such as not obeying the method laid out in RS93) and plainly incorrect statements (such as stating “there was a systematic tendency for the seven-station sites to be relocated to colder locations”). The best answer to that kind of mistake is a simple statement of the mistake. [deep voice: Did somebody say steak?]
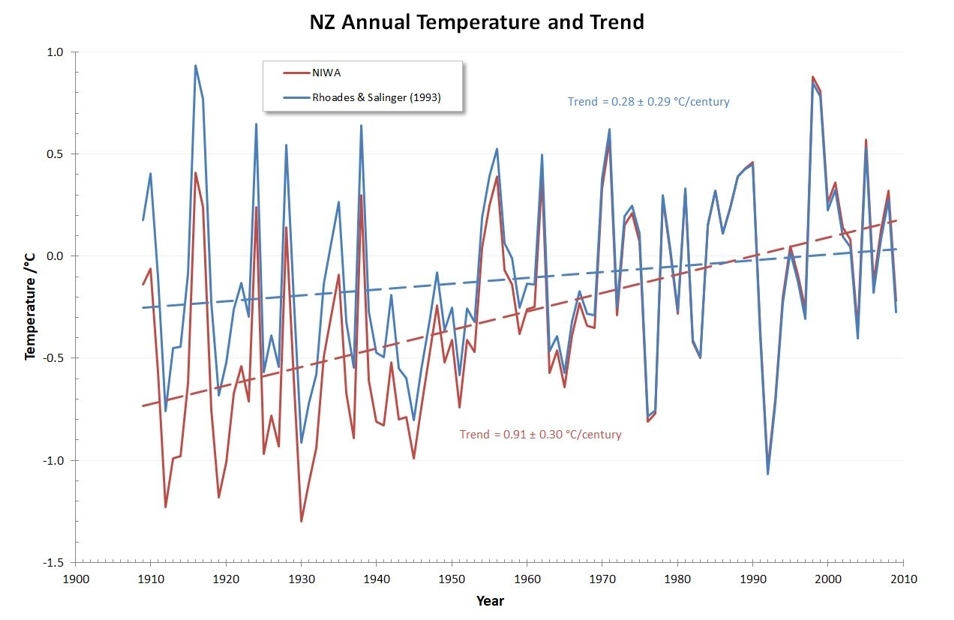
The graph presents a picture which is “worth a thousand words”.
The de Freitas curve and NIWA curve are virtually identical from the mid-1950s onward and all agree that the New Zealand warming trend during the last half-century or so has been approximately zero.
According to the IPCC (AR5, Ch 10), anthropogenic global warming (AGW) did not have any detectable effect until about 1955. So – NIWA (the NZ Government) has found that this country has experienced no warming whatever since the very beginning of the AGW era. To date, New Zealand has been wholly exempt from “Climate Change”.
Of course, NIWA’s contested adjustments seek to reduce the early-20th century historical data by nearly 1°C – allowing NIWA to contend that New Zealand warmed at 2-3 times the global average during 1931-55. This piece of nonsense obviously has nothing to do with greenhouse-induced ‘Climate Change’.
Surface-based global temperature series divide the earth’s surface into equal grid-cells and apply a temperature value by averaging available data from within (or extrapolated to) each cell. These large square cells do not conform to the shape of a country like New Zealand – some are mostly ocean with only a strip of coastal land, others (such as the Southern Alps area) are high-altitude land with no sea. Mean sea surface temperatures around New Zealand are typically 2-3°C lower than adjoining land temperatures and much more constant through both days and seasons.
If you try to measure the temperature changes of any landmass by using a Global temperature series, the result will vary widely dependent on the extent of SST included. The results from near-New Zealand grid-cells vary widely as between HadCRUT3, HadCRUT4, NOAA and GISS. NIWA does not refer to any of these official series.
Berkeley Earth, or BEST, is a privately funded unofficial group which set out to estimate global temperature change since 1750 based on the use of all available data, no matter how patchy or unreliable. It used standard grid-cell methodology and did not separate land from ocean. In the Pacific Ocean near New Zealand its grid cells clearly used a lot more water than land as its absolute mean temperature was constantly about 2°C cooler than New Zealand itself. http://berkeleyearth.lbl.gov/regions/new-zealand
The NIWA Comment claims that Berkeley’s nearby “regional” temperature trend to 2012 coincides with the NIWA land trend to 2008. These are apples and oranges – different datasets in both time and space
The two groups started with entirely different raw temperature data but, in both cases, the temperature trend was zero. All the warming was only “discovered” by using data-massaging techniques. We have no information as to the nature of BEST’s techniques but are told their outcome was IDENTICAL to NIWA’s (to three decimal places). Neither group disclose error bars. The only plausible explanation is that the two methodologies shared the same measurement errors!
Eyeballing the BEST regional trends [at http://berkeleyearth.lbl.gov/regions/new-zealand%5D discloses a BEST trend curve that looks entirely different from that in NIWA’s graph. T-max is flat from 1909 to the 1950s and then climbs sharply during the modern climate change era. Something is seriously amiss here.
Just check the shape of Berkeley Earth’s T-max curve for the “New Zealand Region” at http://berkeleyearth.lbl.gov/regions/new-zealand
It doesn’t look anything like the curve shown in the graph in NIWA’s Comment. It is almost flat during 1909 to 1950s and then goes soaring upwards during the modern ‘global warming” era. Something amiss here.
NIWA comparing the “region” (mainly ocean) during a period ending 2012 with their land-based 7SS ending 2008 is apples and oranges – different datasets in both space and time.
If Jim Salinger says that you have applied his method incorrectly, then it must be so. He developed it.
1. Why did you choose to ignore tmin and tmax inhomogeneities?
2. Why did you ignore RS93 advice to use as long a comparison period as possible?
3. Why did you not discover that Salinger used +-4 periods in your literature review?
4. Why did you not discuss why your result was so anomolous from everyone else?
5. Why did you ignore the methodology advice of Mullan (2012)? Did you not read it?
6. Why did you only use the k=1 correlations?
You can’t compare BEST absolute temperatures with 7SS or 11SS series. BEST is the average of the whole land mass, the other series are biased by station location.
https://www.niwa.co.nz/our-science/climate/information-and-resources/nz-temp-record/temperature-trends-from-raw-data
The oil companies have admitted the science is correct.
The world has started to decarbonise.
The move to renewable energy is unstoppable. That’s all that matters.
Simon,
>If Jim Salinger says that you have applied his method incorrectly, then it must be so. He developed it.
He was co-author. Rhoades was main author.
>1. Why did you choose to ignore tmin and tmax inhomogeneities?
Because NIWA ignored them (see M10). Why did NIWA ignore weightings and significance tests? Why did NIWA use annual instead of monthly values? Why did NIWA use long time periods?
>2. Why did you ignore RS93 advice to use as long a comparison period as possible?
Because of the next sentence in the paper. You know, the one that Mullan deliberately left off his quote.
>3. Why did you not discover that Salinger used +-4 periods in your literature review?
We knew that, but the only peer-reviewed scientific paper in an international journal that deals with this subject used ± 2 years, and laid out the rationale. We understand the rationale. Do you?
>4. Why did you not discuss why your result was so anomolous (sic) from everyone else?
It isn’t. See above.
>5. Why did you ignore the methodology advice of Mullan (2012)? Did you not read it?
We kept the references to grey literature in our paper to a minimum, M10 being the only exception. W&C is a society journal. Read the Prague definition if you have any doubts on this. Even were that not the case, there are other reasons, as we will address at a later point. Stay tuned.
>6. Why did you only use the k=1 correlations?
Because RS93 does. I’m beginning to wonder whether you’ve even read RS93, to be honest.
Simon,
Great riposte from BobD. I’ll add this:
Good enough by itself, but consider, too, that Salinger must make the same complaint against NIWA.
Hmm, yes Richard, I’m sure he had a lot to say about those missing significance tests, weightings, and unsymmetrical annual values spanning up to eleven years either side.
I also wonder what he thinks about them using a very cut-down version* of Karl & Williams (1987) and claiming it’s identical to his paper, and also (simultaneously) preferable.
One wonders why he bothered to write it at all…
* no significance tests, no weightings based on correlations
BobD,
And no fear of being fired.
Richard, would you be able to contact me on e-mail? I am working on something local that relates to this post and I would like some advice if possible.
Cheers, Ian,