CCG Traffic to March

Since the beginning of November, when the software started to record the amount of traffic, to March 2018, these were our top posts.

1 – Energy and fuel Visits: 6,691
2 – USA Visits: 4,413
3 – Solar Visits: 2,928
4 – Refute the nonsense Visits: 2,867
5 – Open thread: 11 July 2013 Visits: 2,524
6 – Listen to us: we control the weather – listen Visits: 2,269
7 – Public climate boffins give poor service Visits: 1,732
8 – Kiribati sinking beneath waves again Visits: 1,164
9 – Climate lawbreakers to face trial Visits: 993
10 – USA Visits: 993

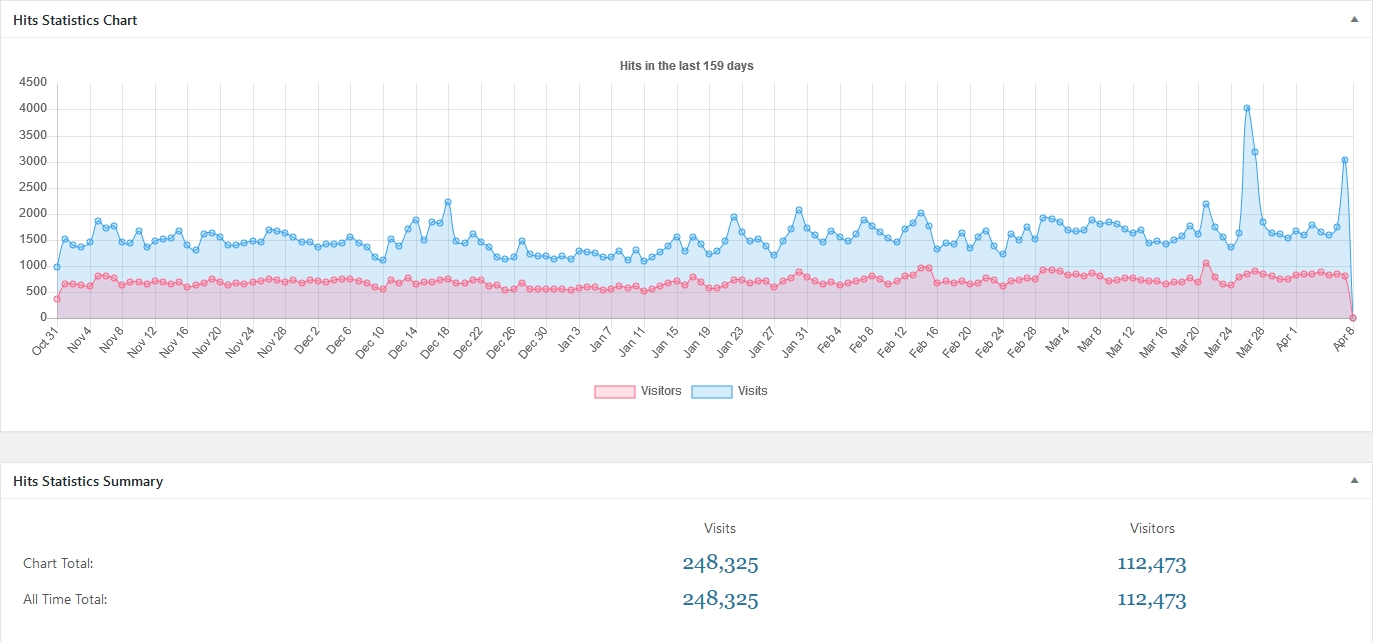
In that time, the total traffic was 247,795 visits from 112,329 unique visitors. That’s an average of 2.2 visits each at a daily rate of 1640 visits by over 740 visitors.

Visits: 205

2 Thoughts on “CCG Traffic to March

  1. Mike Jowsey on 09/04/2018 at 6:22 pm said:

    So?

  2. Richard Treadgold on 09/04/2018 at 8:12 pm said:

    Hi Mike,

    I’m reporting how many people are reading through the blog, nothing more than that. I was intending to report a bit more often than once in several months, but never mind. One hundred and twelve thousand people making a quarter of a million visits in five months shows a widespread interest in climate scepticism.

Leave a Reply

Your email address will not be published. Required fields are marked *

Post Navigation