
A non-trivial audience
I’ll try to post this once a month or so, keep you in touch with the real size of the CCG’s audience.
Hail, O audience!
UPDATE 6 FEB
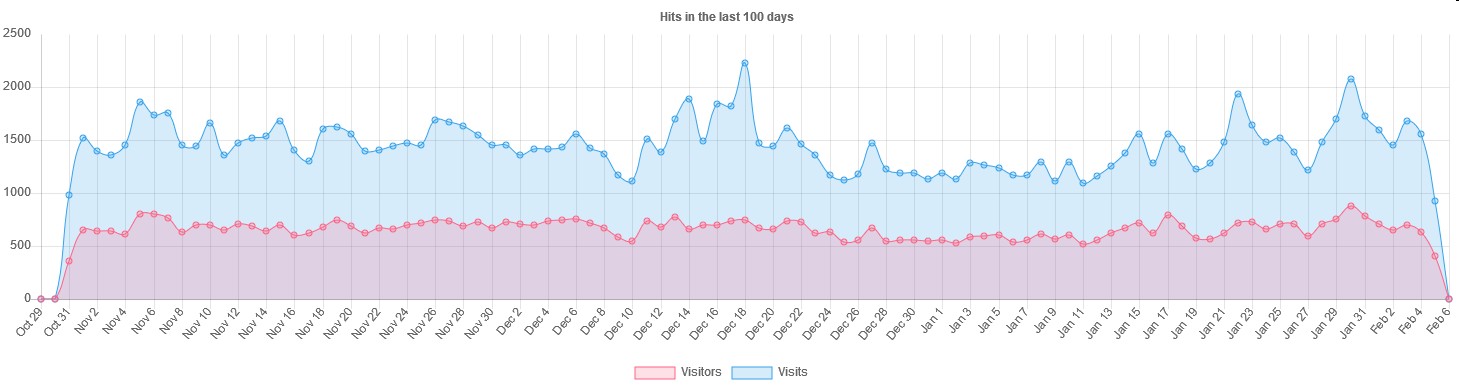
These traffic figures have suddenly reduced themselves, and I think I know why. Only the number of visits has changed, the number of unique visitors has changed only minutely. For example, peak visits on 18 December is now 2232, when two weeks ago it was over 7000, but visitors number 743, when previously they were almost the same at 739. I changed a setting a few days ago that now counts every visitor with over 50 visits in a day as a robot; so it eliminates their visits. I would guess one robot could easily account for up to 1000 page requests, as there are over 1000 posts, so losing 5000 visits might mean there were about five unidentified robots. Most robots are identified by a regularly updated database but it’s not infallible. The change means that more than 50 genuine page requests in a day by a real visitor aren’t counted in the statistics, but it’s the best we can do. I had to let you know of the change, and anyway daily average visits of 1400 is pretty impressive (over 42,000 visits a month). So thanks! You make the striving worthwhile.
Views: 448
Richard,
In the context of the graph (Hits Statistics) I assume “Visitors” means individuals who access the web site. However, does “Visits” really mean “Hits”? In terms of web statistics, ‘hits” is a rather nebulous concept since accessing everything from text to images registers as a “hit”. But individual “visitors” is much more tangible. Even given that some of us might access the site more than once per day, to run for close to 3 months at an average of more than 500 visitors per day is worthy of recognition. Sure, its not as widely known as WUWT, but we are a small country with a small population, and I think the result is noteworthy. Well done, and thanks for making the effort to maintain the Climate Conversation Group.
Thanks, Gary. I checked the documentation for WPStatistics. “Visitors” counts unique IP addresses, “Visits” counts page hits but not images and so on. I see that Visits today topped 7000 for the first time since installation — 7118, to be exact — from 739 unique Visitors. They try to filter out bots, not always successfully.
I had a look at last year’s figures from cPanel and I’m somewhat astonished to see that pages served in the last 30 days, at 143,039, is higher than during the whole of last year. There are two figures for last year: “Number of visits” 210,370 and “Pages” 680,645. Notice that the new software defines a visit as a page request, so it’s hard to know what these two figures represent. But it’s an impressive increase, whichever figure one compares. Taking the larger figure of 680,645, then in an average 30 days last year, 56,720 were served—meaning a recent increase of 152%.
Clearly the method of counting has changed, but I wouldn’t have expected that to make quite such a difference by itself. So, whatever the increase, it’s pleasingly large and an exciting development. But it’s early days.
In the last few years we were getting oddly inflated traffic but it turned out to have been driven by Chinese hackers, evidenced in several DOS attacks which in the end led my hosting supplier to completely ban Chinese traffic.
Thanks for the information Richard.
Pity about the Chinese hackers. How many of their countryman who have a genuine desire to follow the debates have been blocked by their activities? Reminds me of a brief report in today’s DomPost about the vandalising of emergency stop buttons at two of Wellington’s Cable Car stations (https://www.stuff.co.nz/dominion-post/news/100821464/Vandals-damage-emergency-stop-buttons-at-Wellington-Cable-Car-stations)
The actions of a few screwing it for the rest of us.
Quick question RT: Why zero for the first week?
The numbers are marvelous and the trend is upward, by my ancient eyeballs. You must be creating ripples and perhaps waves. #rocktheboat
Good question. The new traffic software wasn’t installed until October 31, and it’s not clever enough to mine the site logs (neither am I). And yes, it does seem to be rising.
Gary, it’s easy to wreck things, not so easy to build them. Would that young men knew how we need them.
Readers may be interested in a recent reconstruction of NZ monthly average maximum temperature variations back to 1852, recently posted here:
https://diymetanalysis.wordpress.com/2018/01/15/example-04-new-zealand-tmax/
Richard,
Very true, but it would be very easy to lose all objectivity and “lash out” at the perpetrators. Like the young people who often walk past our place around midnight with a ghetto blaster at full volume playing some inane rubbish that is so badly distorted that I can’t make it out—even if I wanted to!
I must be getting old. Sigh!