

Climate nightmare
The story of dangerous anthropogenic global warming is painted as a delicate jigsaw. Diverse enigmatic elements mysteriously combine through uncaring human activity to destroy the planet, preventing which is called “the greatest challenge of our generation.”
At root, however, the story is simple; it’s painted as complex to baffle us. At root, our constant carbon dioxide emissions increasingly heat the atmosphere. But we observe that carbon dioxide does not keep heating the atmosphere, which is demonstrably not warming very much and, debunking the warmsters story, this is the coldest period in the last 65 million years, and for the last 420,000 years, natural temperature changes controlled CO2 levels. There has never been runaway warming.
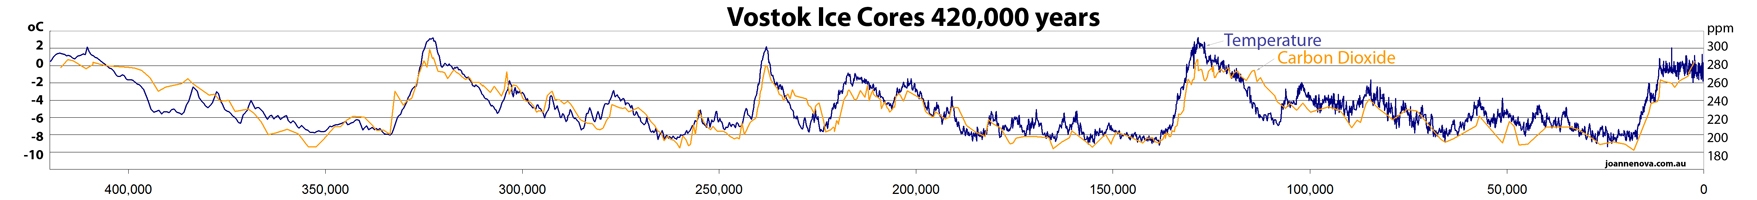
Vostok, Antarctica ice cores. Note CO2 follows temperature for the last 420,000 years. — h/t Jo Nova (click to enlarge)
Climate nightmare
There’s one piece of the climate jigsaw that helps the IPCC and its puppets maintain deep anxiety over human global warming. It’s an outlandish scenario called RCP8.5, which was developed as a useful worst-case planning tool but has been wrongly touted as the “business as usual” option to bully us into action. It paints a blatantly false view of our future.
The RCPs are a set of assumptions that by the year 2100 produce different atmospheric levels of CO2, and thus levels of radiative forcing that in the more extreme scenarios will cause, if we believe the story, the destruction of the earth (whatever that means). They set various levels of future population, economy, land use, energy sources and climate policies. But RCP8.5 is at the extreme end of possibilities, an implausible nightmare in fact, leading to sky-high temperatures and sea levels. So it’s used to incite climate alarm: “Do something, or this is what you’ll face.” The warmsters add embellishments: “Maybe over ten degrees by 2100!” “Maybe 120 metres sea level rise!” “We’re all going to die!”
Daft sea level prediction
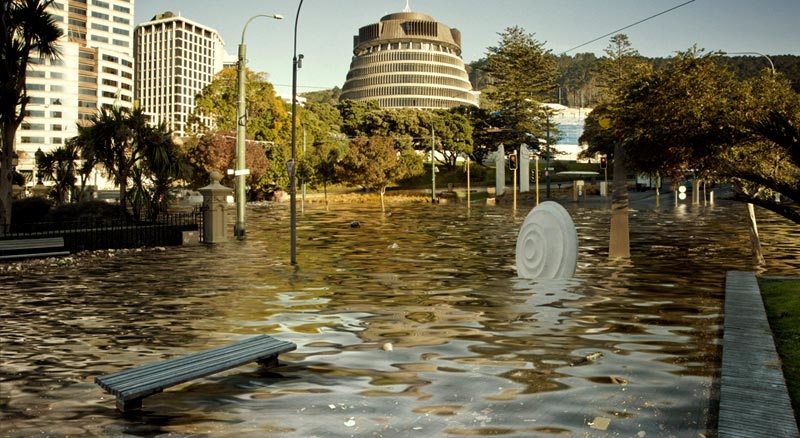
Daft sea level: the capital’s future. NZ temperatures have already risen about one degree in the last 100 years yet sea levels are rising at the same old rate. Won’t they need to accelerate? (credit – VUW Art Dept)
In June 2016, Stuff described Wellington’s future should the temperature warm by just one more Celsius degree and sea levels rise 1.5 metres (refer VUW artwork, right). The author gave what they thought was the science behind the prediction, claiming that moisture collects in warm air and falls as rain, and as the earth gets warmer, there’s more heavy rain. As a result, flooding becomes more frequent. And as temperatures rise, glaciers and ice sheets melt.
To the author: You can be assured that rain will never, ever, raise the level of the sea. Your special assignment this week is to explain this. HINT: where does rain come from? (The bit about land ice melting fails to conceal your ignorance.)
For a good source of information about the RCPs I suggest The representative concentration pathways: an overview (2011), by and others. The abstract explains that the four RCPs were selected from an extensive modelling literature, spanning a range of year 2100 radiative forcing values, 8.5, 6, 4.5 and 2.6 W/m2. The RCP8.5 storyline includes outlandish population growth, but despite that, assumes average income is three times today’s. It’s a highly energy-intensive scenario as a result of high population and a low rate of technology development. Its total energy use climbs to nearly twice that of the lowest scenarios and coal consumption grows to four times the others. With an enormous population and no climate policy, GHG emissions get two or three times larger than the other scenarios and CO2 levels by 2100 exceed 900 ppmv.
The Club of Reason

Reason is often described as a club because it destroys ignorance
Matt Ridley summarises in 2014:
But what about the fourth scenario? This is known as RCP8.5, and it produces 3.5 degrees of warming in 2081-2100 [or 4.3 degrees above pre-industrial levels]. Curious to know what assumptions lay behind this model, I decided to look up the original paper describing the creation of this scenario. Frankly, I was gobsmacked. It is a world that is very, very implausible.
For a start, this is a world of “continuously increasing global population” so that there are 12 billion on the planet. This is more than a billion more than the United Nations expects, and flies in the face of the fact that the world population growth rate has been falling for 50 years and is on course to reach zero – i.e., stable population – in around 2070. More people mean more emissions.
Second, the world is assumed in the RCP8.5 scenario to be burning an astonishing 10 times as much coal as today, producing 50% of its primary energy from coal, compared with about 30% today. Indeed, because oil is assumed to have become scarce, a lot of liquid fuel would then be derived from coal. Nuclear and renewable technologies contribute little, because of a “slow pace of innovation” and hence “fossil fuel technologies continue to dominate the primary energy portfolio over the entire time horizon of the RCP8.5 scenario.” Energy efficiency has improved very little.
These are highly unlikely assumptions. With abundant natural gas displacing coal on a huge scale in the United States today, with the price of solar power plummeting, with nuclear power experiencing a revival, with gigantic methane-hydrate gas resources being discovered on the seabed, with energy efficiency rocketing upwards, and with population growth rates continuing to fall fast in virtually every country in the world, the one thing we can say about RCP8.5 is that it is very, very implausible.
It’s three years since Ridley penned those words and in checking population estimates I found the UN now almost agrees with RCP8.5. I thought Ridley might have been overtaken by the new estimates where he says: “This is more than a billion more than the United Nations expects, and flies in the face of the fact that the world population growth rate has been falling for 50 years and is on course to reach zero – i.e., stable population – in around 2070.” But he remains correct about reaching a stable population about 2070. Fracking for natural gas has reached incredible heights, too, which strengthens his comments.
So on reflection, and noting the large error margins, RCP8.5 is still a high-end scenario. It’s curious that the UN estimate of population now confirms the extremes of RCP8.5, while still firmly embracing the possibility of the mildest of increases, between 9.6 and 13.2 billion. That’s a range of 38%, 3.6 billion people, equivalent to half the current population—which must be having a bob each way.
According to World Population Prospects: The 2017 Revision (pdf, 1.7 MB), there’s a strong possibility (27%) that global population will fall. So anything could happen, but RCP8.5 still represents the high end of possibilities. This is from page 3 of the 2017 Revision:
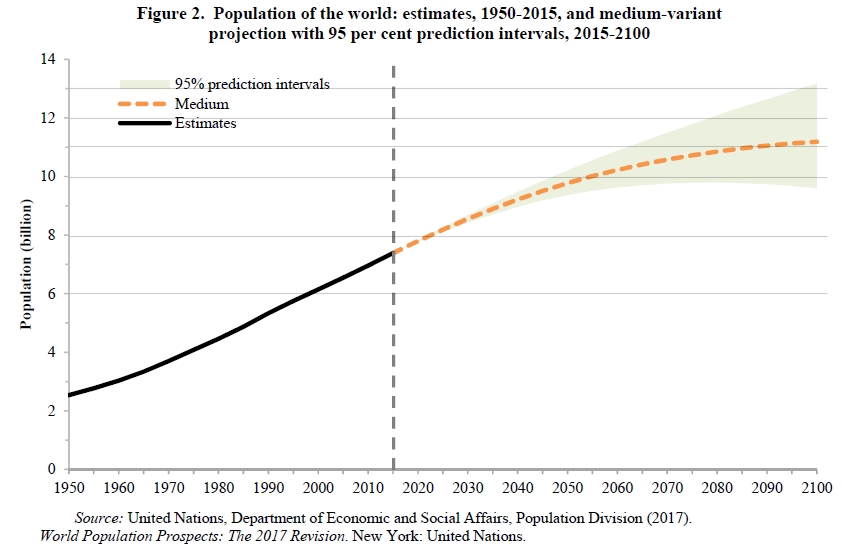
Latest from the UN Department of Economic and Social Affairs/Population Division (2017). I’ve added the horizontal lines to help gauge the numbers (sorry they don’t all line up with the tick marks on the axis).
There is inherent uncertainty in population projections … The results presented [at right] for future years are based on the medium-variant projection of the 2017 Revision … Survival rates are projected to increase in all countries as death rates continue to decline throughout the age range. … the analysis has concluded that, with a certainty of 95 per cent, the size of the global population will stand between 8.4 and 8.7 billion in 2030, between 9.4 and 10.2 billion in 2050, and between 9.6 and 13.2 billion in 2100. Thus, the size of the world’s population is virtually certain to rise over the next few decades. Later in the century … there is roughly a 27 per cent chance that the world’s population could stabilize or even begin to fall sometime before 2100.
It starts with the IPCC
The Intergovernmental Panel on Climate Change has been heavily criticised but has kept up the propaganda barrage. Despite its chairman Pachauri’s sexual misconduct, its use of magazine articles in scientific reports, ignoring its own rules on citing only published papers, its blinkered attitude to papers that contradict its claims and lavish spending on annual junkets in exotic locations, all while chasing the vision of shackling countries to the global grip of the UN, this ambitious behemoth shambles on, beyond the law (it enjoys exemptions from laws of member nations), no electorate and no conscience, immune and unrepentant.
Many believe the IPCC to be a scientific organisation, because that’s how it presents itself, yet with the conclusions of its climate Assessment Reports written by government delegates, not scientists, it isn’t. The IPCC is an openly political organ of the United Nations, charged from its creation with assigning human causes to global warming, not with any fearless search for scientific truth. One long-time observer of the IPCC and dogged exposer of its failings whom I much admire is Canadian journalist Donna Laframboise, author of The Delinquent Teenager Who Was Mistaken for the World’s Top Climate Expert. She describes many of the papers the IPCC refuses to cite and has much to contribute about its failures of process and principle, and its wayward, socialist aims.
The NZ connection
The IPCC has agents and puppets in most nations. New Zealand has many, probably out of proportion to its size, but by now they are prominent in our affairs, from politics to industry, academia and the public bureaucracy.
Professor James Renwick is a senior warmster in the church of climate change, preaching at Victoria University in the School of Geography, Environment and Earth Sciences. He’s a member of the Royal Society of New Zealand, participating as an expert in their major climate projects, a lead author for the last two IPCC climate reports, and has served on numerous international scientific bodies.
We can expect him to know the science and we can take his lead in his areas of expertise. Scientists and lay people alike repeat what he says, he likes talking, so he is an ideal target for our questions.
Here is a video James recorded that I copied last week from the Victoria University of Wellington website, published, according to YouTube, in May, 2016. It’s only a couple of minutes long, so take a gander. He’s cordial, speaks well and is easy to listen to. He makes four main points, namely: global warming is happening, temperature is rising, sea levels are accelerating and we control the climate (so we can cap the warming—such a fashionable arrogance).
Deniers are liars
He says, “There’s absolutely no denying that climate change is happening.”
To which I say: Of course it is. Only children or the mentally infirm can be unaware that climate changes continuously. Saying climate change is happening is like saying the sun is hot.
However, when the UN redefined climate change in 1992 to mean only what is attributed to human activity, “climate change” became exquisitely ambiguous. The warmsters now use it to label their opponents “climate deniers”, a perfectly humiliating sneer that recalls a “holocaust denier”. But Renwick himself is the denier. When he says “there’s no denying climate change occurs”, it’s a sham. He is denying that his opponents accept climate change, but nobody denies that!
One can have legitimate doubts that humans are significantly influencing the weather, or questions about how it could happen, but saying so invites warmsters to ask accusingly: “So you’re a climate denier, are you?” The warmster is happy to sneer and never answers the questions. He ignores the fact that you meant the UN-inspired meaning of “man-made” climate change, about which there are substantial disputes, unanswered questions and, yes, legitimate denials. The ambiguity of “climate change” is inescapable and hard to resolve in the cut and thrust of conversation. I wish Professor Renwick would stop using the term denier, for it is unscientific.
The warmest year
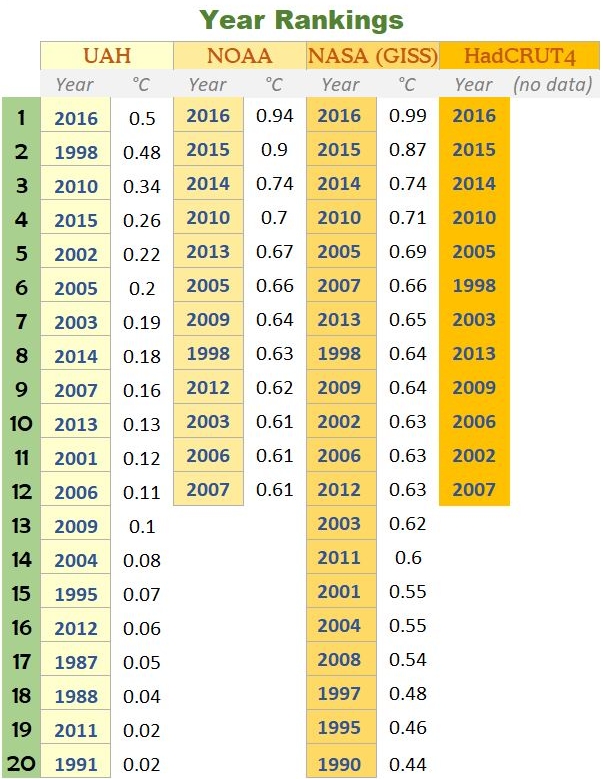
In May 2016, when Renwick claimed “2015 was the warmest year on record globally, by far,” 1998 was the warmest on the UAH record, and other datasets had different records; I’ve gathered four of them here. There are other datasets, too. Point is, he expresses opinion as fact.
click to enlarge
The data can be found at: UAH, January 2017, NOAA Global Climate Report, January 2017, NASA (GISS). HadCRUT4 is another dataset, starting 1850. I don’t have access to their data, but reading it off this graph at Climate4you I get the rankings shown to the right, from hot to less hot (if anyone knows where the HadCRUT4 annual data reside, I could add the temperature figures here).
NOAA, NASA and the CRU agree on the top four years but nothing else, while UAH takes a different view of everything—note that 2016 topped 1998 by a mere 0.02°C. I’m no expert on the global temperature datasets, but I would expect any scientist to treat such varying results with caution and avoid categorical statements like Renwick’s.
Ranking the years is popular, but Renwick is unjustified in implying a trend over a couple of years—putting them together on a line graph, where you can see how the slopes compare, is a more reasonable comparison. It’s ridiculous to say “whaddya know, this year’s hotter again” just because three years show successively higher temperatures (by as little as an unmeasurable 0.03°C, and well within the margin of error), when the usual period to determine a trend is 30 years. As he well knows.
Renwick deceives us
In the video he says: “We’ve seen an acceleration recently in sea level rise. Over the last few years sea level has been going up about 5 or 6 mm per year, which is double the rate it was 20 years ago, which was double the rate it was 50 years ago.”
Prof Renwick knows that the mismatch between tide gauges and satellite altimeters is a highly contentious matter, yet he makes no mention of that, for he prefers to pull the wool over our eyes and deceive the people of New Zealand. Climate4you says: “Data from tide gauges suggest an average global sea-level rise of 1-1.5 mm/yr from 1992 to 2016, while the satellite-derived record suggests a rise of more than 3 mm/yr. The rather marked difference between the two datasets has no broadly accepted explanation …”
There are two points to note: 1. There’s no generally accepted explanation for the disparity between tide gauges and satellite altimetry. 2. It’s unwise to join datasets, in the sense of continuing a graph of one with a graph of the other, because it gives a false view of reality. Therefore you cannot claim that what was slow in the tide gauge record has suddenly got faster in the satellite record. They are mismatched!
You’re free to accept the satellite data, but whether you settle on 3 mm or 6 mm per year, you have to explain your preference for it and why the data from tide gauges is so much lower. Without some explanation, no satellite, which scans vast reaches of the open ocean, can disprove a tide gauge record, which measures changes at one precise coastal location. I took the data for the following examples from the Permanent Service for Mean Sea Level (PSMSL).
If an Auckland gauge records, as one of them does in fact record, that in 94 years to 1998, sea level rose at about 1.3 mm per year, after correction for vertical land movement, then it did actually rise at 1.3 mm per year. Similarly for Dunedin, 98 years to 1998: 3.8 mm/yr and Wellington, 80 years to 1998: 1.5 mm/yr. (See how different they are!) You can accept the satellite record but you cannot change reality; you must still accept that the sea has risen by only 123 mm, 372 mm and 80 mm after all those decades in each place, respectively.
Anything else is daft. And that’s reason.
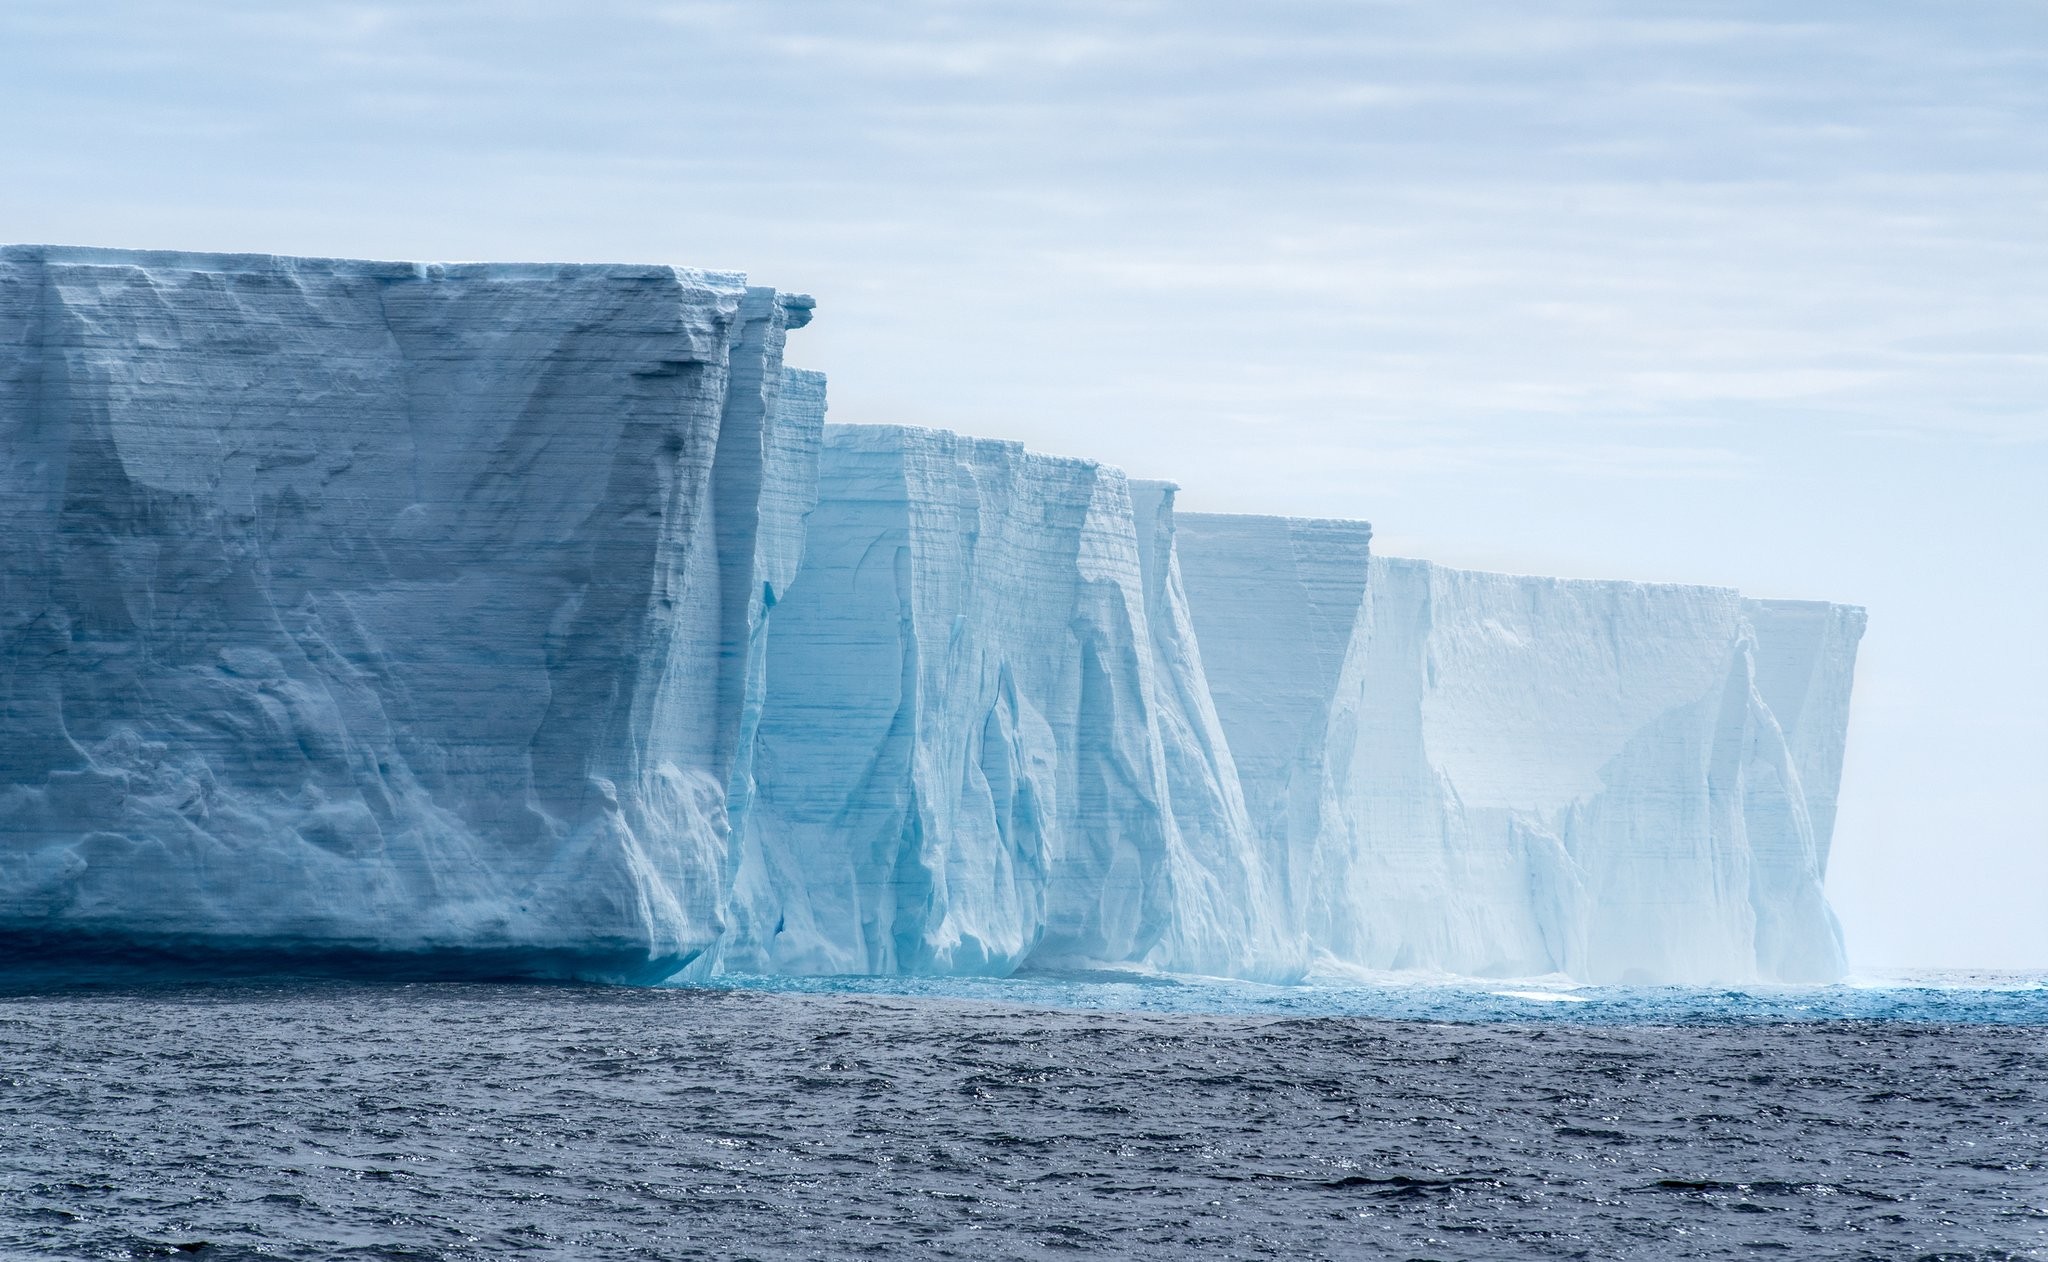
This image of Antarctic ice is unconnected with sea level rise or global warming. It’s apparently iceberg A86 (though I can’t be sure), which calved in July from the Larsen C Ice Shelf. At 175 km long and 5,800 square kilometres, it’s four times the size of London, weighs a trillion tonnes, is 350 metres thick and extends 210 metres down into the ocean. No global warming was involved here. Separation of the gigantic slab of brittle ice was brought about by relentless mechanical forces of tide, wind and gravity. The image is included for a glimpse of nature’s majesty. [click to enlarge (looks great)]
Views: 1207
What happened to 2017 or is the data not out yet?
Oh, sorry, Peter. I was concerned to answer Renwick’s comments, which were made in 2016, so I didn’t include 2017. Some data is available. I suggest you see Roy Spencer’s UAH site, NCDC, and keep an eye on NASA for their release.
Ice core samples tell you nothing about the recent past. It is not stated what Year Zero represents. Note that at Year Zero CO2 concentration is less than 300 ppm. Maybe you would like to estimate from this data what the temperature anomaly would be if CO2 > 400 ppm. There is no title on the x-axis either so there is no telling what the baseline is.
You really need to tell your less informed readers that UAH is an estimate of lower troposphere temperature and is much more sensitive to the effects of ENSO.
There has been a raft of published papers on sea level rise recently, because it is so important. There is evidence of satellite drift affecting sea level estimates so there have been downward corrections. Tide gauge data also has to be homogenised. Both data sets suggest that current global sea level rise is around 2.5-3.0 mm/yr with some evidence of recent acceleration. The bad news is that modelling suggests further acceleration to come given the increasing rate of ice shelf disintegration.
Everyone working in the area of sea level rise acknowledges that you need several decades of data to infer any change in rates, by the time you have filtered out decadal variability.
Therefore, claiming acceleration based on a few years data is not valid. This applies in both directions of course.
When I was at high school some 60 years ago we were taught by our Geography Master that one side of the North Island was rising, one side was sinking and that this played Hell with sea-level gauges in the long term.
We were also taught by the same gentleman that the Manawatu Gorge could never be a stable transport route as it is on the boundary of two techtonic plates where one is pushing it’s way under the other. He also forecast the future earthquake disasters on the East coast of the South Island. I cannot recall him mentioning global warming but he was quite firm about the fact that climate change is always with us and that the Sun is a big atomic reactor at the centre of our Solar system that controls everything with regard to climate in it.
I suspect that our science education wasn’t too bad in those pre-computer, pre-all-pervasive media days.
A key point regarding the four “representative pathways” that are used in IPCC’s AR5 is that they are based on incompatible assumptions inter se. Unlike the SRES scenarios which preceded them, a user of IPCC projections cannot average or aggregate the four Pathways. They are alternative viewpoints. Any user must select which Pathway they regard as most likely.
The IPCC was at pains to point out that it had no view on which Pathway was likely, because that is not a scientific question. It is a question for futurists, economists, demographers, soothsayers, philosophers, politicians, or Gypsy fortune-tellers. But choosing a Pathway remains a pre-requisite to reliance on the CMIP5 suite of future projections published in 5AR.
This pre-requisite has been taken on board by our own NIWA and is built into its “online tool for exploring temperature and precipitation projections” at https://ofcnz.niwa.co.nz/#/home. You cannot find out the projected rainfall for Oamaru in 2090 without first choosing a RCP.
Nobody suggests the four incompatible RCPs bear equal probability. RCP8.5 is a far-out extreme that nobody would pick except in the throes of fever dreams. It is there for the use of activists and lobbyists – not scientists.
Alarmists like to say that RCP8.5 is balanced by RCP2.6 which is equally improbable. But this is obvious nonsense. If one were to simply project forward the CO2 levels of the last 20 years, the forcing outcome is LOWER than the 2.6 Pathway. And projections are the best way we know (if not the only way) of guessing the future.
An “increasing rate of ice shelf disintegration”? Are you sure Simon?
Chris Mooney of the Washington Post, a long-standing alarmist, reports a huge increase in net snowfall in Antarctica – positively halving the rate of SLR.
https://www.washingtonpost.com/news/energy-environment/wp/2018/01/03/large-antarctic-snowfall-increases-could-counter-sea-level-rise-scientists-say/?utm_term=.dcc10e561e7e
Scientific American notes that these new findings suggest that Antarctica is currently not contributing to sea-level rise at all but helping to check it by stashing away 0.23 millimeter of fresh water every year.
A NASA graph of local mean sea level as measured by tide gauges shows no acceleration during the 20th century. The change over 130 years has been 150mm (about 1.2mm/annum). https://climate.nasa.gov/vital-signs/sea-level
On the same page, a satellite altimetry graph of eustatic sea level shows no acceleration since such measures began in 1993. The average rate of change of the latter is 3.2 ± 0.4mm/annum.
https://climate.nasa.gov/vital-signs/sea-level/
Greenland last year had record level ice GAIN. Record breaking. This year is above average, but not as much so as last year. www.dmi.dk/en/groenland/maalinger/greenland-ice-sheet-surface-mass-budget/ .
However, the best news is that Dr Judith Curry has commenced preparation of a comprehensive report on sea level rise, and is inviting input at https://judithcurry.com/2018/01/16/sea-level-rise-acceleration-or-not-part-i-introduction.
By the time this series is complete and published, many arguments will be resolved. Curry is one of the few who can be trusted to bridge the gap between the two armed tribes.
Adding to Barry’s comments about RCP above, I note that Christchurch City Council (maybe MfE, I’m not sure) came up with the RCP 8.5+ scenario.
I think this was so extreme that it made policymakers think that RCP8.5 is reasonable, which is in fact what is driving policy in ChCh and elsewhere.
Man-made global warming has progressed from hypothesis – perhaps originating with Fourier in 1824 – to theory. That is, there is a Comprehensive and Coherent explanation of the observations and measurements made in many areas of science – Consilience. Experts have judged the evidence is unambiguous, it is human activity that is causing Earth to retain more energy: temperatures up ice down.
There is no scientific debate. Scientific debate takes place in the journals, not crank sites. If you deny the science, endorsed by every scientific institution and society (RS, NAS, AAAS, APS, ACS…) then you can rightly be called a denier.
Professor James Renwick is quite correct.
https://www.scientificamerican.com/article/2017-ranked-among-three-hottest-years-ever/
Dennis, if you read what the scientists say, you will see that what you call the non-existent debate flourishes. But even beyond academia, sceptical people like us, curious to research climate science, raise questions. These are not inspired by ideology but by inconsistencies we find in the evidence and explanations we’re given, but certain of our questions are not being answered, and more questions arrive from around the world. It would be absurd to abandon our queries, for much money and disruption is being spent and employed in the name of an unevidenced problem. It’s ludicrous that educated men come along and label us cranks and deniers when we are simply asking well-researched questions in a courteous way. I will shortly explain where Renwick is actually quite wrong, but even if he were consistently correct, he has no more right to be rude or sarcastic than you.
Andy, what do you mean by RCP8.5+? Does it include extra sea level rise?
Let’s be quite clear about this:
THERE IS NO SCIENTIFIC DEBATE ABOUT MAN-MADE GLOBAL WARMING.
Not in the scientific literature.
Seeking to learn is one thing; challenging the science that is now in standard textbooks is totally irrational. .
Andrew Dessler: Introduction to Modern Climate Change, Cambridge University Press.
John Houghton: Global Warming the complete briefing, Cambridge University Press.
Uncertainty about measurements is not the same as debate about principles.
Scientists like Ivar Giaever, Freeman Dyson, William Happer, and our friend Michael Kelly can talk all they like but they have not published. Nor will they, because they talk absolute rubbish.
Let’s be quite clear about this:
‘There is no scientific debate about man-made global warming’
BUT THERE IS DEBATE AS TO THE EXTENT OF MAN’S CONTRIBUTION TO THE WARMING.
If there is no debate over the extent of man’s contribution then why are there multiple climate models, & why have the models failed when compared to the empirical temperature datasets PUBLISHED in the IPCC AR5 report?
Nice try with the straw man argument dear boy, but no cigar.
Dennis, what Magoo said—quantify the human influence on climate. You might like first to locate some evidence that it’s been observed, although you’ll probably have to resort to model output, but at least that’s better than whining all the time. Also, let go of your nonsensical allegations of irrationality and notice that all I (we) have done is to ask questions. If you really know everything about this, stop simply quoting the acronyms of scientific institutions and answer our questions.
Over the many years of my life I have developed a strong sense of unease about the use of our language. PC or not, it is fair to say that language appears to have been “dumbed down”. Whether it is due to poorer teaching, or increasing laziness and unconcern about the importance of language I cannot say. I can only deplore it. In the 60s and 70s when I was teaching chemical engineering at the University of Melbourne, I used to implore my students to work with a dictionary beside them. Not to learn how to spell a word, but to ascertain that the word they chose had the meaning they were trying to convey.
One of Dennis’ comments above demonstrates the problem (my emphases).
A dictionary definition of “hypothesis” (Collins English Disctionary) is “… an idea which is suggested as a possible explanation for a particular situation or condition, but which has not yet been proved to be correct.”
The same dictionary defines “theory” as “… a formal idea or set of ideas that is intended to explain something.”
Far from meaning something distinctly different, these definitions are essentially synonyms, the key phrases being, “not yet proved to be correct.” And, “intended to explain.”
To write that an idea has progressed from a hypothesis to a theory therefore has no meaning and it does not demonstrate that the “idea” has become a fact. It does not justify the epithets Dennis aims at those who express scepticism about the hypothesis.
Better get a dictionary, Dennis.
Gary, I would walk beside you to the ends of the earth. However, I must differ somewhat on this, and I’ll be most interested to hear your response. I have heard that scientific reason goes rather in this order:
1. Hypothesis. Postulate that some observed phenomenon proceeds or is caused by some element or mechanism.
2. Experiment. Perform observations under natural or artificial conditions.
3. Theory. Confirm or modify the postulate, which becomes a theory.
4. The world takes over and after an unspecified time begins to generally accept the theory or it is disproved.
You are of course correct about the similarities of the words hypothesis and theory, but in this specific scientific usage they are differentiated in this way and become technical terms.
In support, let me offer this from the University of Waikato website:
Also this from a site curiously named Futurism (soon to become, no doubt, outdated):
In this, I would allow that Dennis is right.
Never, Sir! Never!
A long time ago, one of my colleagues at the University of Melbourne casually asked, in the Engineering Staff Common Room one morning, what the plural of octopus would be. He received several responses with the usual guesses of octopi, octopuses, etc. To which he replied that they were all wrong because the root was Greek and the correct plural was octopodes. I wasn’t exactly happy with this, so I went back to my study and looked in my faithful copy of Fowler. I was amused to see that he commented that the plural was octopuses: octopi was incorrect and octopodes was pedantic.
And herein lies the rub. Which came first? I don’t know. The Collins English Dictionary suggests that they came into use in the 16th Century, both being derived from Greek via Latin. I seem to recall that when Einstein developed his ideas they immediately became known as the special theory of relativity and later the general theory of relativity. Someone may be able to correct me if I am not correct. However, at that stage, the “theories” had not been proved and Einstein is said to have said, when learning that a substantial body of scientists had been convened to disprove them, “Why so many? It takes only one!”
On this note, therefore, the pedant in me reiterates that hypothesis and theory are synonyms, and you will find them designated as such on several internet dictionary sites. Indeed the English Thesaurus on the Collins English Dictionary site show the synonyms of theory as hypothesis, belief, assumption, conjecture, feeling. The same site shows the synonyms of hypothesis as theory, assumption, premise, proposition, etc. Perhaps the definitions you traced are an example of the problem I deplored earlier relating to “Usage and Abusage” of the English Language. But you had to look it up, didn’t you, and that is always worthwhile (I had to look for more synonyms, and the etymology!)
We may agree to disagree on this Richard, but I’m happy to rest my case 😇.
And I am happy, Gary, with the extra richness you have brought to my understanding.
I’m not even sure what the conjecture is that we are supposed to be proving/disproving.
Most of us agree that CO2 has some role (however small) in regulating the climate. The bigger claim (often left unsaid) is that CO2 is a major driver of climate
Somewhat off-topic, but in case you haven’t seen it, the UK Channel 4 interview with Prof Jordan Peterson is really worth a watch
https://www.youtube.com/watch?v=aMcjxSThD54
(This video has received over 2.3 million views in the last week and is attracting a barrage of commentary across all media platforms)
The relevance to the so-called climate debate shouldn’t be lost on us. Peterson counters the interviewers strawman arguments with logic, reason and politeness
I agree. Peterson is an impressive man. I watched it yesterday and can scarcely stop thinking about it. It’s absolutely relevant to the climate debate.
That interview leads to the thought that climate alarmism is not abut science at all, but is just an outcrop of a post-Berlin-Wall worldview that demands new threats and challenges to keep the adrenaline flowing.
Lacking clear external enemies, animus seems to have been turned inwards as guilt, self-loathing, anti-humanism, etc. Victimhood reigns supreme, and those who have been mainly responsible for building prosperous and successful Western societies are now expected to apologise for doing so.
If you want a checklist of the faux issues that now dominate “elite” conversation, just jot down those in which you can confidently predict the stance that will be taken by all our ‘mainstream media’ (NZ Herald, Fairfax, TVNZ, RNZ): climate change, identity politics, gender equity, reverse racism (affirmative action), hate speech, rape culture, Islamic innocence, etc.
The ‘culture wars’ have taken over the US colloquy, where the warring tribes have added gun laws, open borders, and white privilege. It’s interesting that the best illustration yet of the competing worldviews came from the Channel 4 debate between a Canadian and an Englishwoman.
Hi Barry
Yes of course I agree that the climate change narrative has more than science about it
It fits perfectly into the neo-Marxist/post-modernist worldview of victims and oppressors.
This is not, of course, to say that there is no valid climate science. Yet, I would say, the activist branch of the climate science community feed this narrative, which in turn feeds them via kudos and funding.
The Peterson/Newman interview is fascinating. It has spawned countless video analyses and memes.
“…..It is human activity that is causing Earth to retain more energy…….” asserts our resident troll, Dennis Horne.
More energy, Dennis?….yeah, more energy, …here’s what i say about more energy….
https://sciblogs.co.nz/guestwork/2017/07/19/inaction-climate-change-risks-leaving-future-generations-530-trillion-debt/#comment-262396
And you might also like to read this little conversation I’ve had with a political aspirant from down south…
https://localbodies-bsprout.blogspot.co.nz/2018/01/climate-change-just-got-personal.html
You should join the Greens, Dennis, and teach them how to fly aeroplanes.
Andy, Richard,
I couldn’t agree more, and I have been arguing for some years that we do not do our view of climate science any credit by stooping to invective in response to the illogical, bitter, ad hominem, and intemperate remarks so often resorted to by proponents (often non-scientific) of the AGW hypothesis. No matter how angry they might make us. I think my wife sometimes fears for our TV when I encounter some particularly inane remarks!
Of the interview, I found it almost comforting to note that we are not the only ones to suffer journalists/interviewers who carry their own agendas into confrontation with the person they happen to be interviewing.
@Mack. No climate scientist denies the greenhouse effect due to greenhouses gases.
You are a loony.
Nah, Horne, you’re the loon…You’re the loon who still believes in some old, outdated, unreal, crackpot “greenhouse” hypothesis. You’re the loon who still thinks that a trace gas wafts around in the air above the ocean waves, and by means of “backradiation”, warms the water beneath it, more than it would be otherwise by the sun. A special padded cell for you, Horne, for that sort of lunatic thinking.
You’re the loon who actually thinks that the ATMOSPHERE prevents the OCEANS from becoming totally FROZEN solid. You’re the loon, who actually comes up with figures, saying that without this “greenhouse effect” the average surface temperature of the Earth is MINUS 18 deg C., with all water on this planet frozen solid !…. and that the ATMOSPHERE with this “greenhouse effect” brings us up to the real average liveable temperature of about 15 deg C. You’re allotted to another padded cell with even thicker walls for that sort of lunacy, Horne.
Nah, it’s the SUN , you stupid loon, Horne. It’s the SUN what melts ice, you loon.