
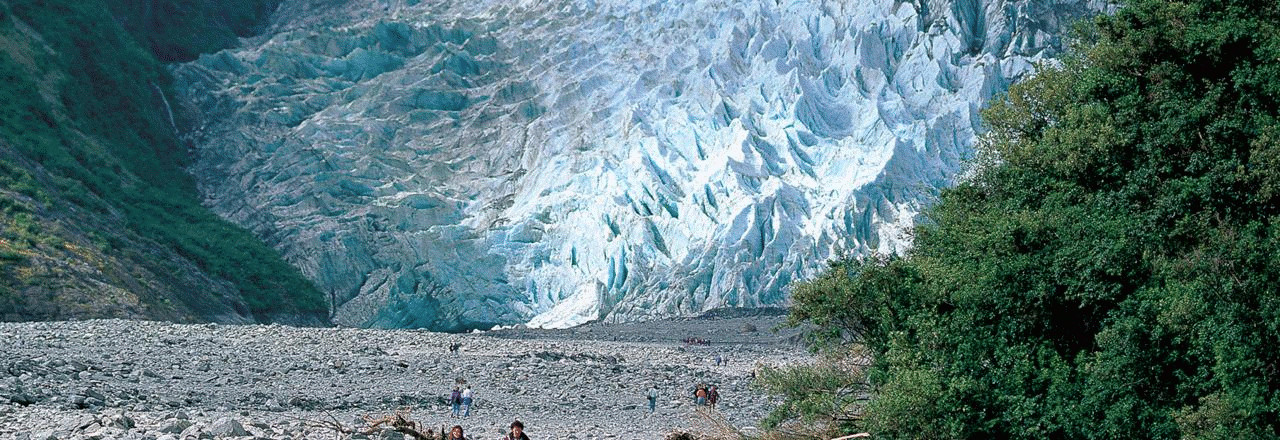
Franz Josef glacier, New Zealand
Stupefying reversal after all the propaganda
The warmsters have been squawking at us since the IPCC was founded in 1988 for using abundant, affordable hydrocarbons to power engines and to create all kinds of materials, from the ordinary (like tar and ink) to the fantastical (like heart valves and aspirin). They demand we stop drilling anywhere, stop mining anywhere and stop creating affordable products to improve and save lives. But this is blinkered madness oozing from the dystopian IPCC stink-tank.
The warmsters think colourless, tasteless, non-toxic, harmless emissions of carbon dioxide from our life-improving, life-saving industry and transport are wrecking the planet — though evidence is absent — while they ignore the inconvenient truth that high-energy-density hydrocarbons, in only about 150 years, have lifted countless millions around the world out of a short, brutish life of poverty and into the health, education, income and comfort levels of the middle classes.
World-saving climate activists, all of them comfortable members of either the upper class or these new middle classes, consider it their self-harming duty to destroy our prosperous lifestyle on the grounds that humans are to the Earth a cancerous infection, as they so savagely put it.
However, some New Zealand warmsters have changed their tune on recent warming because, wondrously, despite their 30-year-long chorus of calamity, we in New Zealand (and only in New Zealand) have actually been cooling for all of 25 years.
Yes, it’s been cooling all along
Regional cooling caused recent New Zealand glacier advances in a period of global warming (2017), by Andrew Mackintosh, Brian Anderson, Andrew Lorrey, James Renwick, et al. (“MAL17”), claims that the New Zealand region was cooling naturally between 1983 and 2008, from before the IPCC was set up.
That’s almost the conventional 30 years for determining climatology — why has it taken nine years to discover it? Why have they been telling us that instead of cooling we can see the results of warming in New Zealand? It hasn’t been warming.
It’s a stupefying reversal after decades of propaganda from NIWA and our universities. Yet nothing has been published in the MSM, probably because the paper contradicts their usual message of climate catastrophe.
I posted initial thoughts on this in Part 1 back in March. But my health deteriorated, sapping energy and over the next few months demanding changes in my lifestyle; thankfully it has improved and I’ve dusted off my notes on this paper. I’m keen to take a close look at a New Zealand paper by New Zealand scientists on a New Zealand climate topic, so this second article looks at the paper more closely and asks why the lead author declined to provide the temperature data; Part 3 will look at ramifications for the national temperature record, the Seven Station Series, or 7SS.
The new paper’s abstract concludes with:
While this sequence of climate variability and its effect on New Zealand glaciers is unusual on a global scale, it remains consistent with a climate system that is being modified by humans.
My friend Joe Fone points out with fine objectivity:
It is also consistent with a climate modified by Nature.
Which I am hard pressed to refute.
Emissions reprimand
Regular readers will notice first that MAL17 comes out of a coterie of earth scientists from Victoria University’s Antarctic Research Centre and the School of Geography, and NIWA, our premier climate “institute”, an ingenious, profit-model amalgam of businessmen and public servants shielded from public scrutiny of their actions by the legally impermeable cloak of crown privilege.
The paper concludes: “We show that air temperature in New Zealand is the major driver of glacier mass balance during the advance phase between 1980 and 2005.”
Cooler air temperatures in their “simple” model were responsible for 56% of the glacial advance, precipitation another 27% and 17% came from humidity, winds and clouds. So it was cooling and it was complex.
We might anticipate that the authors would contrive to reprimand us over our emissions by regurgitating the IPCC message, and so it proves. Their “modified by humans” remark carries the usual implied rebuke that, like ignorant animals, we’re destroying our own ecosystem.
But how are we destroying it? We should be in no doubt what is being said here. In plain English, “modified by humans” means warming. Nobody claims our emissions of CO2 cause significant cooling, nor do we contribute in any way to wind speed, precipitation or air pressure, except on an extremely small scale. Our only significant influence on climate is through warming—if you believe the theory. There’s still no credible evidence.
When it hasn’t warmed for 20 years, are we responsible for any warming?
So they’re saying that the cooling they observe in the glacier record is consistent with warming, and that is simply incomprehensible, because if we’re causing warming, we cannot also be causing cooling. Anyway, nothing in the paper supports that assertion—it stands alone like a very lonely thing in a distant, lonely field.
It should be noted that we probably cause a little cooling by aerosols, which absorb sunlight and seem to have a minor cooling effect. However, we often observe the warmsters emphasising the possible, if undemonstrated, involvement of aerosol emissions during periods of cooling, or they claim we were “masking” man-made warming. Though our indisputable fingerprints remain undetected, the warmsters want to find them on everything.
Which is politics, not science.
Land and sea temperatures influence air temperature, not vice versa
The paper claims, in effect, that a period of colder air reduced the usual amount of glacial melt. But normally the air takes its temperature from the land or water, as described in standard texts, such as this one from NOAA. Internet search results are full of descriptions of SST affecting air temperature over land and water. There is no description of heat energy flowing the other way. Air temperatures don’t significantly influence land or ocean temperatures.
The simple reason for this is the vast imbalance between the heat capacities of water (and land) and of air. Wikipedia tells us:
Water’s specific heat capacity is 4200 Jkg<sup>-1</sup>K<sup>-1</sup> and Air’s is 993 Jkg<sup>-1</sup>K<sup>-1</sup> therefore water has 4.23 times more specific heat capacity.
So to warm water by one degree you need 4.23 times the amount of heat that warms air by one degree. The ocean simply overwhelms the relatively meagre amount of heat energy the air can contain. Either it powerfully warms the air or, if frozen, squeezes out its last vestige of heat and converts it to an icy blast.
However there’s an important difference between the ocean and a glacier: to reach a mountain glacier, the air doesn’t usually pass over much ice. Wherever it has come from, over water or forest or frozen mountain tops, there’s little or no time to acclimatise to the glacial environment. It’s gone in mere seconds or a few minutes at most, having (perhaps) imparted significant energy to the ice. The never-ending stream of warmer air, even only a few tenths of a degree cooler than usual, could involve many joules of energy and thus exert a significant influence on the glacier.
So how much atmospheric cooling did the study find? Below is Figure 6: Diagnostic experiments with energy balance over the model grid. Look at the Temperature anomaly panel (b).
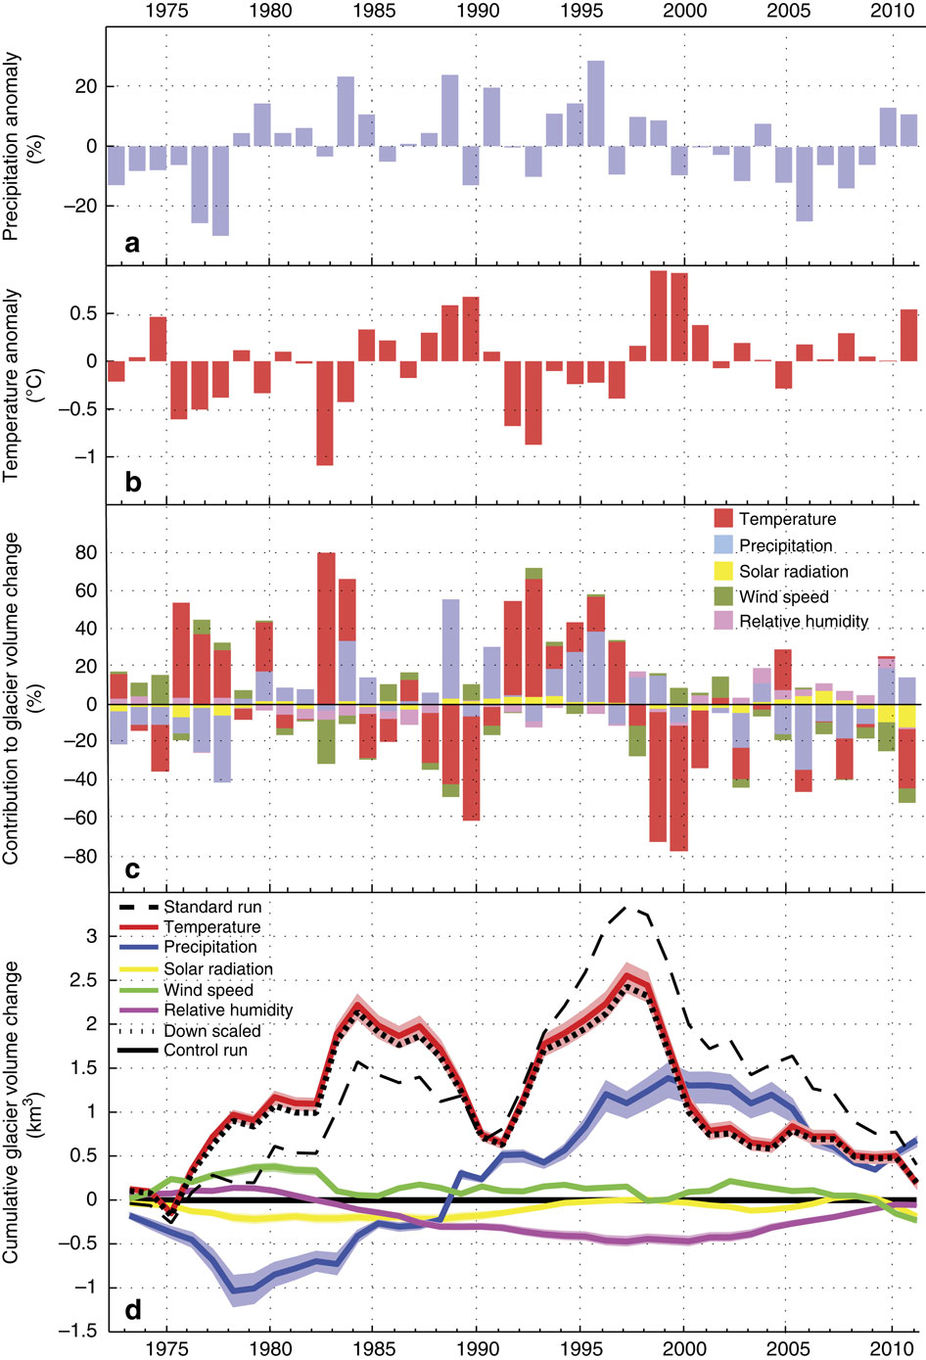
It shows the maximum air temperature anomalies were about ±1°C, which occurred in four of the 39 years studied. On page 15 of the Supplementary Information is Supplementary Table 4 (below), showing upper (positive, mass gain) and lower (negative, mass loss) quintile years for modelled glacier mass balance volume change anomalies. The table singles out 16 years (8 of greatest ice loss, 8 of greatest ice gain) and we’re interested in the Temperature anomaly column, showing that year’s anomaly. The largest anomaly in each group, about 1°C, occurred in 1983 (cool, -1.06°C) and 1999 (warm, 0.95°C).
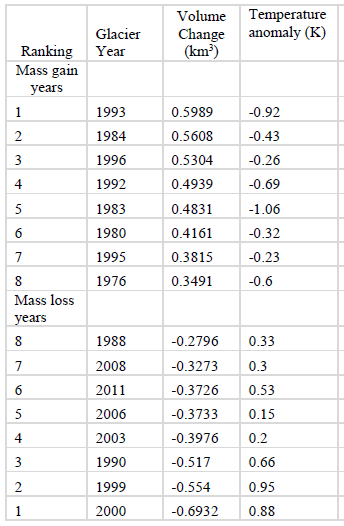
The average of the temperature anomalies in the top 20% of mass gain years was -0.6°C; the average in the top 20% of mass loss years was 0.88°C. Remember they’re modelled temperatures, not observations.
What these figures are telling us is that the glacier advance phase was triggered by remarkably tiny temperature changes. Cooling changes averaged -0.6°C. Such a large reward of glacial advance from such a meagre investment in cooling. Amazing.
Such are models? Or would actual observations reveal something different?
How many glaciers are enough?
The study looked at 58 prominent NZ glaciers from a total inventory of some 3150. That’s only 1.8% of the country’s glaciers, and though they cover fully a third the area and two thirds the volume of our glaciers, one must wonder how these findings might have changed if the other 3092 had been included.
The authors note a 2015 paper that announced an “Historically unprecedented global glacier decline.” It studied about 500 glaciers worldwide, from a global inventory of perhaps 200,000 glaciers larger than about 25 acres, or 10 hectares. From that study our authors said “a largely homogeneous trend of retreat” was found globally. This, from a study of only 0.25% of the world’s glaciers.
A startling claim made from a vanishingly small sample is not firmly persuasive.
In any case, why do the melting glaciers matter? We don’t exactly need them, at least not the small ones here in New Zealand and from what I’ve seen, the gigantic ones in the Himalayas (some of which are important sources of water for drinking and irrigation), Greenland and Antarctica will take hundreds of years to vanish.
We hardly need glaciers as thermometers: we already have thermometers. Also, glacier growth responds in various ways to precipitation, humidity, winds and clouds and is strongly tied to the topography it’s moving over, its own mass, and its cross-sectional dimensions. If temperatures were rising (which they’re not at the moment), it would be difficult to use glaciers to confirm it.
By the way, Dr Mackintosh in February was quoted as saying:
Since the period of advance ended in 2008, the glaciers in the Southern Alps have seen a “massive retreat.”
“If we get the two-to-four degrees of warming expected by the end of the century, our glaciers are going to mostly disappear.”
This directly attributes our retreating glaciers to man-made global warming.
New Zealand’s 3150 glaciers constitute about 1.6% of the world’s glaciers, yet the 58 in the latest study constitute a full 12% of the world’s studied glaciers. The idea that all the Earth’s glaciers have been retreating has to be reassessed, because this study shows that fully 12% of them have been, despite the trend, advancing, not shrinking. Only 88% of the world’s studied glaciers have been retreating. Does the IPCC know? What will they do?
MAL17 says: “Unsurprisingly, low temperatures are also recorded in the ‘New Zealand temperature series’ during the positive glacier mass balance years identified in this study.” It seems a little odd to discover an unremarked cool spell during a period previously claimed to be warming, but there’s always some fluctuation.
But we need their data for confirmation. Dr Mackintosh said they used stations close to their study region in the Southern Alps and hinted they weren’t available in NIWA’s public database, Cliflo. I will ask again for the data.
Summary of shrinking thinking over recent years
I refer above to propaganda during the study period from NIWA and other global warming enthusiasts who sang a repetitive refrain about our glaciers shrinking. Here are news clippings showing what are now, in the light of this paper, extraordinary claims that glaciers were doing the exact opposite of what we now know was true.
The principal message of this propaganda is of course relentless warming. Any of us claiming cooling or even just a pause in the warming was subject to mockery and abuse.
18 November 2007 – New Zealand’s glaciers are shrinking and twelve of the largest glaciers in the Southern Alps are unlikely to return to their earlier lengths without extraordinary cooling of the climate. Research released by NIWA today shows that the volume of ice in the Southern Alps has reduced by almost 11% in the past 30 years.
2008 – Glacier response to climate change (pdf, 182 KB) – Despite continued regional warming, [the second phase of warming, from 1977,] has been a time of alternating gains and losses, resulting in a near zero ice-mass change of the Southern Alps glaciers over the last three decades. … the climate has been warming. Despite the vast quantities of ice that have been lost in the Southern Alps because of regional warming in the last 30 years, the complete disappearance of our glaciers is a distant prospect. As long as there is a snowline there will be glaciers.
2009 – Otago University criticised the lack of glacier research, saying “global climate change has major implications for the environment and economy of New Zealand. The lack of systematic study of glaciers in New Zealand and the Ross Dependency, particularly the absence of a mass balance experiment in which the inputs and outputs of a glacier are monitored, is a major deficiency in New Zealand’s research profile.
Meaning: give us more money.
May 2010 – Glacier Change reported the Donne Glacier had been “undergoing rapid retreat this decade creating a new alpine lake.”
15 July 2012 – Scientists revealed this past week New Zealand’s famous Franz Josef Glacier is dramatically retreating. Dr Trevor Chinn, in 1978, started the first and only survey of NZ glaciers, counting 3144 of them. He says, “a few small glaciers on [the] list have since disappeared, starved to death from climate change.”
Starved? Death? I don’t think so. It’s no tragedy if glaciers melt occasionally and if snow falls again they will return, that’s what creates them. The new paper tells us the Franz Josef has advanced “nearly continuously” between 1983 and 2008. Did its “dramatic retreat” last only four years? A glacier exists as long as snow can stay frozen and build up to about 30 m thick, when it’s generally heavy enough to flow under gravity. It only needs precipitation.
29 July 2014 – NIWA was again reporting warming-induced shrinking, in The Guardian: New Zealand’s vast Southern Alps mountain range has lost a third of its permanent snow and ice over the past four decades, diminishing some of the country’s most spectacular glaciers, new research has found. A study of aerial surveys conducted by the National Institute of Water and Atmospheric Research (NIWA) discovered that the Southern Alps’ ice volume has shrunk by 34% since 1977.
9 August 2016 – Glaciologist Dr Brian Anderson (one of the authors of MAL17) was quoted in Stuff (while he must have been working on the new paper showing cooling): “It’s not a good story,” he said. “These glaciers are going to get really small – it’s quite scary.” Why is it scary? Why didn’t he mention the cooling in Stuff?
Where’s the data?
I emailed the lead author, Andrew Mackintosh:
I’m studying your recently released paper on the regional cooling influence on local glaciers and I’m very interested to understand the temperature series across your model domain during the period of study. I wonder if you have annual or glacier year data and whether it’s possible to have access to the temperature dataset used in your simulations, please?
He replied promptly:
The annual anomalies are in Supplementary Table 4, at least for the most positive and most negative glacier mass balance years. I don’t think there is any discrepancy with the 7 station series – the same cool years – e.g. see Figure 5 in the attached – can be seen in both. However, direct comparison isn’t easy as our ‘years’ are ‘glacier years’ (April to following March, rather than January – December).The model uses daily temperature data but I don’t think I can forward these on without agreement from NIWA as these data are not one of their standard products and we used them under contract. We basically use interpolated station data though so there shouldn’t be any mismatch with the 7 station data.
Then I mentioned what I thought he had said:
But you surprise me by asserting there’s no mismatch. To a layman, a warming trend in the 7SS by definition doesn’t match the cooling trend in your Regional Cooling paper. Or is that an incorrect characterization of your paper?
Andrew explained:
Our paper doesn’t reveal a cooling trend. More like a cluster of cold years especially in the early to mid-1990s but also at other times. Viewed from 1970s to today, there has definitely been a warming trend. [his emphasis]
So the temperature went down, they titled the paper “Regional cooling”, but it was too short to call it a trend (remember, they’re usually looking for a minimum of 30 years. But there’s been a period of regional cooling, ergo, to a layman a cooling trend, albeit brief, and regional, albeit limited. It only remains to find which were the cold years, just how cold they were and how much, if at all, New Zealand has warmed since the end of the cooling period in 2008, during the great global warming hiatus.
So for the data. I’ll ask Andrew Mackintosh for it again and report his reply next time.
Penetrating comments welcome, especially critical ones. I suspect there are threads of this story still in matted clumps that should be teased apart.
Views: 871
This may be a useful paper to read also
http://www.whoi.edu/cms/files/solomina16qsr_238964.pdf
An overview of the retreats/advances of Earth’s glaciers (excluding Antarctica) in the last 2000 years.
Hi Richard,
I’m sorry to hear that you had some health issues, but hopefully you are back on track now.
It’s good to see you blogging again,
Cheers
Andy
Thanks, Andy! I like it, too. I see an article from your namesake Andy Reisinger today in the Herald that cries out for a few comments. When I finish this blasted work I’ll kick-start my blogging pencil.
Wonderful investigative piece RT. Sorry to hear it was hampered by your (lack of) health. But glad to hear it wasn’t a more pervasive malaise with CCG!
Andrew Mackintosh seems to be a polite and erudite scientist investing much effort in trying to understand how glaciers can grow in a warming South Island. Even when it’s cooling. But not trend-wise. Crikey. How does he keep such poise when it’s matted clumps aplenty?
I think you are right to press in on models vs. observations, glacier years vs. 7SS, and what trends are displayed in the data.
The big takeaway is the glaciers are not starving to death! Yay!!! This should be world headline news. (Tui Ad).
Thanks, Mike. Yeah, right! I did publish a few billboards along the lines of (all right, faithfully mimicking) the Tui ads (like this one) but I had to stop when I got a letter from their lawyers demanding I cease and desist.