NZ Climate Science Coalition & Climate Conversation Group
Are we feeling warmer yet?
Supplementary Information
Raw NIWA data and Salinger anomalies — Hokitika station
30 Nov 2009
Introduction
A number of people have now asked us for the raw data we used to create the unadjusted versus adjusted temperature graphs in our study Are we feeling warmer yet?. We will shortly post a list of station names from the NIWA CliFlo database. While we could post the data directly, it would be fairly pointless, as you would need to know in detail the weather stations and the methods we used to combine them. Each station required some experimentation and detective work, assumptions had to be made and we may well have made errors. We make no claim to be infallible, so we publish these notes to let the reader judge whether our study has merit.
We will shortly be making the Salinger adjusted dataset available. We would like to thank Warwick Hughes for providing us with that data.
In this document we want to work through an example weather station—Hokitika—to illustrate our approach and methods. We also want to address NIWA’s response, currently
on their website, that the Wellington adjustments are justified by altitude differences between stations where no time series overlap is available (Thorndon, Kelburn and Airport). The assumption is made by NIWA that stations can be adjusted together in such cases (even though they have no common overlap period and are also separated both spatially and temporally) as long as they share a common height above sea level.By giving examples of stations with both altitude separation and an overlap period, we show that the lapse rate can differ and even the sign of the temperature difference can be reversed. Some higher stations record warmer temperatures than nearby lower stations. Therefore, it is invalid to move two station records together simply because they share a station height.
NIWA
We believe NIWA have many fine scientists who do New Zealand proud. Some of us have worked in research institutes over many years and we understand the dedication scientists can bring to their work, so we have no wish to quarrel with them. However, some of the political policies being pursued in the name of "settled science" demand the highest levels of openness and transparency from the proponents of those policies and the scientific organisations that support them.
With the current scandal over the disclosure of the CRU emails and code and the involvement of some of NIWA’s staff in those emails, it is naive to pretend that New Zealand might remain somehow untouched. So we believe it is now especially important to ensure that ordinary citizens and taxpayers can be confident of open, honest handling of public data and are free to question official wisdom.
What we have shown to date is that the warming claimed by NIWA comes from adjustments, which they do not dispute. So the quality and validity of these adjustments are now paramount but we cannot judge them until they are placed by NIWA in the public domain. We do not understand why they have not done this already. If the adjustments are valid, we must accept the results, whether they mean warming or cooling.
Whether human factors influenced the temperature trend is another topic.
Salinger anomalies
It’s really difficult to reverse engineer a graph such as the NIWA graph unless you have some good clues as to what station data to start with. Even then, it’s not an easy task. None of our work would have been possible without obtaining the Salinger station anomaly data used to create the NIWA graph.
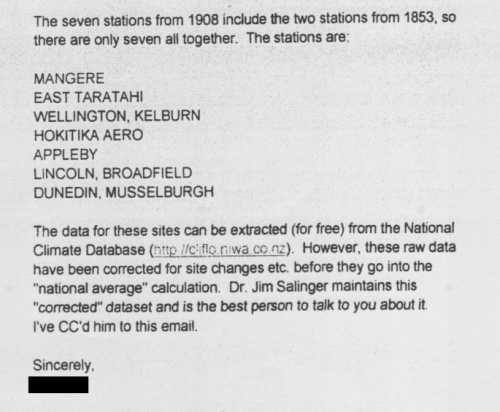
In the past, the Coalition has enquired of NIWA regarding the graph posted on their website. A response was received that indicated the stations used were:
- Mangere
- East Taratahi
- Wellington, Kelburn
- Hokitika Aero
- Appleby
- Lincoln, Broadfield
- Dunedin, Musselburgh
In that communication, NIWA stated that the data for these sites could be downloaded for free from the National Climate Database (
http://cliflo.niwa.co.nz), but warned that the raw data had been corrected for "site changes, etc." before they went into the national average calculation. They said that Dr Jim Salinger maintains the "corrected" dataset and was the best person to speak to about it. The writer mentioned he had copied the message to Dr Salinger. Here is a portion of that email:We have blanked out the correspondent’s name because we have no wish to embarrass someone who was helpful.
No reply was received from Dr Salinger and subsequent requests for the corrections produced no reply. A similar query was sent in the past six weeks to Dr James Renwick, Principal Scientist at the National Climate Centre, but no response has been received.
This is not the first time our queries have been ignored. Warwick Hughes has also attempted to get the corrections from Dr Jim Salinger, and although he received some of the adjusted data three years ago, he was not informed of the adjustments themselves.
The Salinger adjusted data are labelled as follows:
- Auckland
- Masterton
- Wellington
- Nelson
- Hokitika
- Lincoln
- Dunedin
This is different from the list provided by NIWA and caused some confusion. For now, we want an unambiguous station to look at, so we’ve chosen Hokitika.
Reproducing a station history
Some of the station histories are fairly simple. For example, the CliFlo database reveals that Hokitika seems to be made up of Hokitika South from 1866 to 1965, followed by Hokitika Aero until the present. There was a decent 14-month overlap during the closing of South and the opening of Aero.
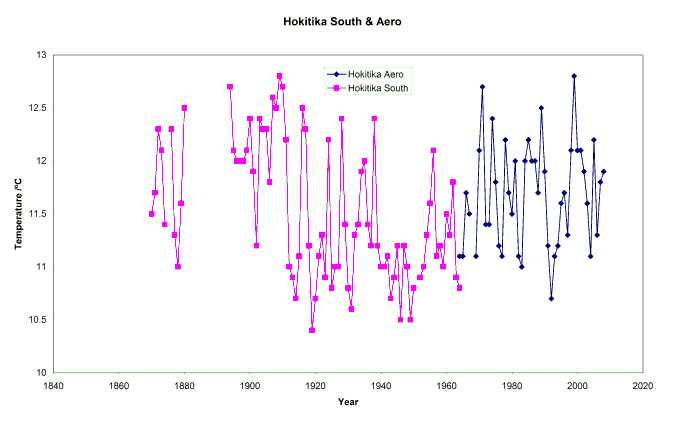
If you plot the NIWA data for these two Hokitika stations, you end up with the following:
Note the overlap period in 1964/5, and the lower South station values at that time.
The interesting thing to note is that South is 0.3ºC cooler than Aero. Yet South is at the lower altitude of 4 m and Aero is higher, at 39 m. According to NIWA’s Wellington Thorndon explanation, the higher station should be cooler, based on the expected environmental lapse rate.
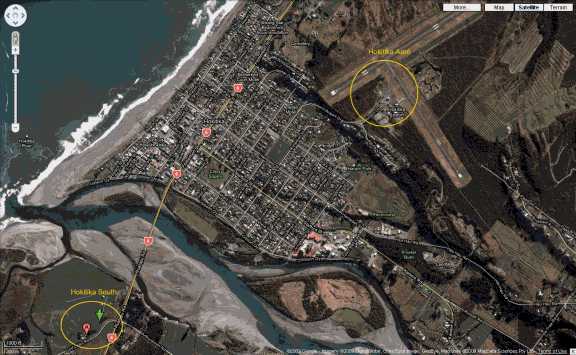
Figure -1: Hokitika showing the station locations based on NIWA Lat/Long values
However, as many people have pointed out, you can’t make that assumption. Here we have a station almost at sea level (Hokitika South) reading (during the overlap period 1964/5) on average 0.3ºC colder than the other at 39 m altitude (Hokitika Aero). So the altitude reasoning doesn’t always work. Had there not been an overlap period to show us differently, NIWA would presumably have dropped all values prior to 1965 by 0.2ºC instead of raising them by 0.3ºC. A data adjustment based on that faulty assumption would have caused a substantial 0.5ºC error in Hokitika.
(In the case of Wellington NIWA decided that the 0.8ºC drop between Thorndon and Kelburn was justified because of the height difference and the relationship, based purely on similar height, between Thorndon and Wellington Airport. It also seemed to make sense because the theoretical environmental lapse rate of 1ºC per 154 m should produce a 0.8ºC drop in temperature, and that was the difference between Airport and Kelburn.)
Auckland is another example where the assumption is unsupported. Albert Park is at 49 m, and Mangere is at 2 m. Theoretically, Albert Park should be colder by about 0.3ºC. The opposite is true. On average, Mangere was 0.65ºC colder than Albert Park over the 1962 to 1989 overlap period. That means the error is almost a full 1ºC! There is, we believe, a good reason for this, and we’ll come back to it another time.
Again, if there was no overlap period, NIWA (using their Thorndon logic) would have increased the Albert Park values when splicing the curves, creating a completely erroneous record for Auckland.
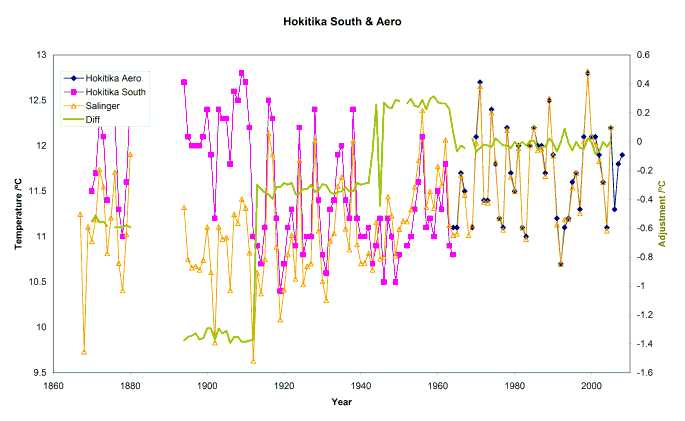
Below is the temperature record for Hokitika Aero and Hokitika South: reading from the right, we see no real adjustments of the Aero data in the recent period back to the 1960s. Note the scale for reading the green difference line is on the right (the Adjustments/ºC scale). At the 1964/5 point, we see a 0.3ºC increase for prior values. Using NIWA’s station altitude logic, this is in the wrong direction. The lower altitude station temperatures should have been reduced by 0.3ºC. Perhaps the overlap temperatures cause the adjustment—we’re not told, but this would make sense, as they differ by 0.3ºC in the overlap period.
However, in 1943 there is a sudden drop, from the previous +0.3ºC to -0.35ºC. This is a -0.65ºC adjustment. The station log shows that a screen was replaced in 1943. There is also a cryptic entry in the log that refers to "instruments" being moved to a new site, but just prior to that they discussed rainfall instruments. Perhaps it was temperature instruments too. It’s unlikely to be a full station move, as there’s no record of a new station.
However, had there been some major change that affected the station, shouldn’t the temperatures have changed in some obvious manner? The monthly values and annual averages in the period before and after August 1943 show no step jump or other drastic change.
Here are the annual averages:
|
Hokitika South |
1939 |
11.2 |
|
Hokitika South |
1940 |
11 |
|
Hokitika South |
1941 |
11 |
|
Hokitika South |
1942 |
11.1 |
|
Hokitika South |
1943 |
10.7 |
|
Hokitika South |
1944 |
10.9 |
|
Hokitika South |
1945 |
11.2 |
|
Hokitika South |
1946 |
10.5 |
|
Hokitika South |
1947 |
11.2 |
Even if you average the four years prior to 1943 and compare it with the years following you only get a 0.125ºC difference. It’s difficult to see why a 0.65ºC decrease was applied to all temperatures between 1912 and 1943.
Even if the instruments were previously at another undocumented site, it would have had to have been higher in altitude, since the South station is listed as being at 4 m, in other words almost at sea level. Another station could hardly be lower, and if the previous station had been higher, according to NIWA’s Thorndon logic, the previous temperatures should have been raised, not lowered.
So something very important and mysterious happened in 1943. Then in 1912 came the largest adjustment of all: 1.34ºC downwards. The station log that year mentions a new screen and moving the rain gauge. The adjustment should in theory have been still at +0.3ºC based on the 1965 adjustment, so the overall effect is -1.64ºC. That’s a large decrease, and being so near the start of the curve, it produces a steep trend. Presumably NIWA would have been very confident of their calculations before making such an adjustment. According to Anderson et al. (2008) there is every reason to believe the Hokitika adjustments are too extreme. They suggest reducing the 1864 to 1911 adjustment and removing the 1911 to 1943 adjustment completely.
From the 1860s to the 1880s it increases a bit to only -0.55ºC, or -0.85ºC below where we would expect it to be based on the 1965 overlap. That’s still a large reduction. Here is the station history from CliFlo for this station.
Site Change History
|
Site Change Date |
Description |
|
01-Jan-1866 |
Station opened at rear of government buildings. Good exposure. |
|
02-Jan-1866 |
Max-Min recorded in tenth degF 1866-1880. |
|
30-Dec-1880 |
Forms record max on day-of-reading up to Dec 1880. (Max has been shifted back 1-day in MAX_MIN_TEMP table). |
|
31-Dec-1880 |
Observations ceased. |
|
01-Jan-1894 |
Observations recommenced. |
|
02-Jan-1894 |
Max-Min recorded in half-degF 1894-1899. |
|
03-Jan-1894 |
Forms record max on day-of-reading up to Dec-1899. (Max has been shifted back 1-day in MAX_MIN_TEMP table). |
|
10-Sep-1912 |
A new screen was installed. The enclosure was too small. The raingauge was moved to improve exposure. |
|
19-Jan-1928 |
Routine inspection. The raingauge was loose in a box and probably underestimated rain. Screen needed painting. Sunshine recorder on roof and inconvenient for observer to change cards. Enclosure still too small at 2.1 m by 2.7 m. |
|
25-May-1929 |
Routine inspection. No problems. The enclosure had been enlarged on 24 October 1928 to 15 m by 12 m. |
|
10-Jan-1931 |
Routine inspection. Rusty tacks needed replacing to secure louvres in screen. |
|
03-Dec-1934 |
Routine inspection. The raingauge was moved to improve exposure and reset to correct height. Grass minimum thermometer giving problems and replaced. Other instruments in good order. |
|
14-Feb-1937 |
Routine inspection. No problems. |
|
24-Jun-1937 |
Routine inspection. No problems. |
|
01-Aug-1942 |
Dines gauge transferred to airport. |
|
25-Jul-1943 |
Routine inspection. Screen in poor shape and repaired. Raingauge had small inner can which often overflows. To be replaced. Instruments to be moved to new site effective August 1943. |
|
13-Jan-1944 |
Manual raingauge replaced. |
|
22-May-1944 |
Routine inspection. No problem. First inspection of Hokitika Southside. |
|
05-Jul-1944 |
Routine inspection. No problems. |
|
07-Aug-1945 |
Routine inspection. |
|
11-Oct-1948 |
Routine inspection. |
|
03-Mar-1953 |
Routine inspection. No problems. |
|
09-Aug-1957 |
Routine inspection. No problems. Very good station. |
|
31-Dec-1964 |
Station replaced by F20793 which opened in November 1963. |
|
28-Feb-1965 |
STATS CODES 00,42, continued AFTER station shut on 19641231 |
|
31-Dec-1965 |
STATS CODES 22,23,24,25,26,28, continued AFTER station shut on 19641231 |
There may well be good reasons for these adjustments—perhaps there were other, undocumented station moves. But just what they are is unclear to us. We believe, however, that the public interest justifies our asking what the adjustments were and what they were for.
There is one other point we should make here. The NIWA/Salinger graph on the NIWA web site creates a certain impression. Its caption states: "Figure 7: Mean annual temperature over New Zealand, from 1853 to 2008 inclusive, based on between 2 (from 1853) and 7 (from 1908) long-term station records.
"To the uninitiated, it could sound as though the seven stations have been operating for a long time with little to disturb them and have been producing solid, dependable data all this time, hence the reason they were chosen. But this would be a false impression. In reality we see station records spliced together from many different sites with no overlaps and adjustments made continually for various undisclosed reasons.
We look forward to seeing the station adjustment histories from NIWA.


